Stereoscopic Display Technologies and Their Applications in Medical Imaging
The recent evolution of 3-D display technology will impact medical-imaging visualization. 3-D reconstruction systems and stereo cameras are widely available in medical modalities, and improved stereo 3-D visualization will enable new procedures and easier interaction with volumetric anatomy data. New image-quality metrics and basic requirements for stereo 3-D displays are therefore under development.
by Luigi Albani, Cédric Marchessoux, and Tom Kimpe
AS 3-D direct-view imaging systems are emerging in practically every display-related market (professional and consumer), it becomes increasingly important to have a method to qualify the displayed stereoscopic images. In the case of 2-D imaging systems, extensive work has already been done in the field of image and display qualification through the so-called human-visual-system (HVS) based metrics for image-quality assessment.1-3 In the 3-D domain, however, such metrics have not yet been developed, although some preliminary results have already been published.4-6 Nowadays, the majority of 3-D image-quality assessments still rely strongly on user tests 7,8,27,29,30 or applications,28 whereas for medical applications, image quality is crucial. Since there is no full and reliable stereoscopic human-vision model, some metrics to assess the quality of stereoscopic images have already been proposed. These rely on the combination of a 2-D metric and a disparity map comparison6 or on a simplified matching process between the left and right view to end up with a cyclopean view that is then qualified using a 2-D image-quality metric.7 The use of a depth map to arrive at a cyclopean image (a mental image that contains information from the left and right view as well as depth information) can be helpful locally as well, as it enables features at different depth planes to be treated separately.9
For stereoscopic images, it is possible to use a 2-D image-quality metric to do an assessment of both the right- and left-view image and then combine the obtained metrics. This, however, does not take into account the depth information induced by the parallax between the two views. One could also define a metric for the disparity map and then combine it with the metrics for the left and right views to obtain one stereoscopic image metric. The approach proposed in this article combines the two views (left and right) and the depth information into one so-called cyclopean image using the data available in the disparity map [Fig. 1(a)]. This article will also investigate a proposed metric that can qualify 3-D medical images starting from a reference image. Several image-quality attributes that are crucial for medical applications, such as noise, blurring, contrast, or compression artifacts, can be estimated with this new methodology.
A Proposed Methodology
The stereoscopic image-qualification method could rely on the creation of a cyclopean image (normal view when looking at the scene) that could be scored with respect to a reference image using, for instance, the SSIM method used in 2-D image qualification.10,11 This metric is limited to gray scale. Instead of using SSIM, the C4 metric described in Ref. 26 could also be used. The cyclopean image can be constructed from the left- and right-view image using the disparity map or the depth map associated with the stereoscopic image. The disparity map links pixels in the left- and right-view image that correspond with the same point in the stereoscopic image. In the approach proposed here, the disparity is defined as the horizontal displacement between corresponding pixels in the left- and right-view images with the position of the left-view image pixels as the reference position.
The 3-D objects created for Fig. 1 are, for simplicity, a set of spheres. The different spheres are projected onto the screen for both views, and afterwards the results of the different spheres are added to yield the total left and right view of the scene. The proposed approach allows for reasonable computation time in comparison with more general matching methods. One or both of the views needs to be degraded or altered with respect to the reference image. A combination of blurring by convolution (a filter size of 11 or 21 pixels and a standard deviation: of six pixels) and lossy compression with JPEG (compression ratio from 10 to 75%) is examined in this article.
Fig. 1: (a) The spheres show the best image quality. (b) The spheres show the worst image quality. (c) The SSIM-based stereoscopic image-quality metric appears in schematic form. (d) The average observer score and the SSIM value are compared.
Employing the relative luminance values corresponding with both views using Lc = [Ll2 + Lr2 + 2LlLrcos(θ)]1/2, 13 the cyclopean pixel can be calculated. Both summation and inhibition phenomena are taken into account depending on θ (the angle describing the amount of luminance summation occurring). The combination function ensures that Fechner's paradox is taken into account when luminance differences are present between the left and right views. Fechner's paradox corresponds to the fact that sometimes the brightness in binocular mode may be perceived to be not as bright as it is in monocular vision, due to luminance differences between the right and the left views. L is the luminance of the pixel (subscripts represent cyclopean left-view and right-view pixel, respectively). A θ = 120° is chosen because it corresponds to images with a large range of frequencies with a dominant inhibition factor. SSIM is an objective metric that can compare the structure of two images. The SSIM metric is applied on the reference and test cyclopean images to identify the differences between these images. The SSIM-based stereoscopic image-quality metric discussed above can be validated using a psycho-visual study with a set of images to be scored both by five observers in a normalized environment14 as well as the SSIM-based method. The set consists of 40 stereoscopic images, of which 10 are used for the intra-observer variance computation, resulting in 50 images to score for each observer. The observers are asked to score the test image relative to two reference anchor images (high and low quality).
As a preliminary result, Fig. 1(c) shows the average scaled observer score along with the associated error bars and the SSIM-based scores. So these results could be compared, the observer scores were scaled to the same region as the SSIM-based results. From the results shown in Fig. 1(d), it can be seen that generally a rather good correspondence exists between the SSIM-based metric and the observertest results. For the observer reproducibility, the scattering and the Kurtosis tests were used. The Kurtosis test, described in the norm ITU-R 500-10,16 allows accepting or rejecting an observer by estimating the variation between one observer and the others, using the inter-observer variance. For the scattering, most of the observers have a low value. The averaged scattering for the five observers is equal to 2.3% with a minimum value of 1.9% and a maximum value of 2.6%. None of the observers is rejected by the Kurtosis test.
Applications in Medical Imaging
Recent studies indicate the benefits of stereoscopic imaging in diagnostic tasks such as early detection of breast cancer.23-25 In standard 2-D mammography, "subtle lesions may be masked by the superimposition of overlying or underlying normal breast tissue and thus are undetectable"; on the contrary, "in a stereoscopic X-ray view of the breast, the subtle lesion is directly seen volumetrically, separated from overlying and underlying normal tissue in depth." 24 However, this technology has some limitations. The display is gray scale and the acquisition of the X-ray images needs to be adapted from the normal routine with two orientations – cranial caudal and medio-lateral oblique – to generate stereoscopic views per orientation. Also, the display itself is not so practical in terms of ergonomics (space, cleaning, etc.).
Nevertheless, clinical trials in Australia showed how – compared to standard digital mammography – the stereo methodology significantly reduced false-positive lesion detections by 46% and significantly increased true-positive lesion detections by 23%.25
In general, the benefits of 3-D imaging apply for nearly all types of medical images, and applications can range from surgery (neurosurgery, cardiac intervention, computer- or robot-assisted surgery, minimally invasive surgery, or surgical training) to intervention planning, radiotherapy, endoscopy, etc. Adoption of advanced 3-D visualization technologies directly impacts productivity, accuracy in the task, and safety. As an example, through 3-D vision a doctor can clearly distinguish if a blood vessel is in front of or behind another one and the doctor can immediately evaluate the depth of tumors.
Minimally invasive procedures have signaled a revolution in surgical intervention where remote operation and visualization techniques have been continuously improving to make these operations as natural as the traditional open-surgery procedures. One of the largest challenges in laparoscopic surgical training is the adaptation of a two-dimensional flat view of the surgical field. Stereo visual-ization can provide a more natural view as well as improved hand-eye coordination through augmented depth perception induced by binocular parallax and convergence depth cues.
In performance-oriented tasks, stereo 3-D displays – now becoming popular at a premium for entertainment and amusement purposes – will improve accuracy, reduce procedure time, and enable a shorter training period. The reason that the majority of the endoscope systems are now based on 2-D visualization is probably related to the limited quality of the 3-D displays available compared to the binocular eyepiece vision used in critical laparoscopic interventions with robot-assisted surgery.
Recent investments in 3-D technologies will enable the adoption of stereoscopic endoscopes with 3-D screens as soon as the latter demonstrate the appropriate level of image quality through a careful balance of brightness, resolution, crosstalk, and the sweet spot in the stereo visualization that is required to avoid visual discomfort.
3-D Display Solution and Motivation
In operating rooms, typically a full-HD 24-/26-in. display for personal viewing is used by the surgeon as well as for assistance or training purposes. Among the currently available technological options, the "passive-glasses solution" based on patterned-retarder displays has been selected as the most suitable one for minimally invasive surgical procedures. Autostereoscopic (glasses-free) displays currently have limited resolution and a fairly limited "sweet spot." Three-dimensional time-sequential displays based on active-shutter glasses are, most recently, reaching a performance level where they can be used by surgeons, but the ergonomics present challenges in operating-room environments. In comparison, 3-D polarized glasses are lighter, as well as more stable and reliable, and possibly disposable. This 3-D solution is based on a cross-polarized filter (quarter-wave retarder) that – combined with the linear-polarized light emitted by the LCD panel – displays alternated lines with opposite circular polarization (see Fig. 2).
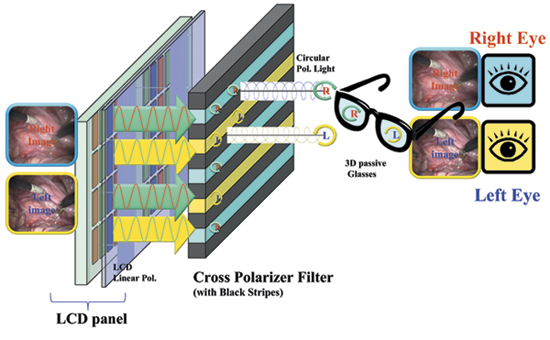
Fig. 2: This 3-D LCD construction is based on passive-glasses technology.
Assessment and Performance
Crosstalk creates ghosting in the viewed images, which is considered a major cause of visual discomfort and becomes a critical factor in performance-oriented tasks.18 Ghosting makes stereoscopic 3-D images hard to fuse, due to a loss of contrast and depth resolution. A definition of crosstalk as a physical entity that is objectively measurable is the system crosstalk (SCT), which describes the degree of light leakage through the unintended eye path generated by the display system under consideration.17,19 A different metric is viewer crosstalk (VCT) or the crosstalk perceived by the viewer. This is defined as the ratio of the luminance of an unwanted ghost image, which leaks from the other eye image, to the correct luminance received by the viewer's eyes.19 System crosstalk is independent of the content and characterizes the display, whereas VCT varies depending upon the content. The visibility of crosstalk is related to the binocular parallax in the co-located pixel and is proportional to the image contrast.17 The amount of crosstalk considered acceptable or unacceptable is defined in the literature as follows: "crosstalk between 2 and 6% significantly affected image quality and visual comfort20; a crosstalk level of about 5% can induce visual discomfort in half of the population."17 A crosstalk-visibility threshold of about 1% for natural content is recommended for professional 3-D displays.
For the sake of clarity, the crosstalk definition and its calculation are reported here in accordance with recent publication. It is under evaluation for new IEC and ICDM 3-D display-metrology standards.
The measurement of system crosstalk is performed by applying simultaneously a black-and-white two-view pattern, where the subscript left is referred to as "view 1" and right is referred to as "view 2," and where the "kw" subscript refers to the source image left = black and right = white. The center luminance is measured in the normal direction to the center of the display using a spectro-radiometer after the matched left/right eye glasses.19
The SCT experienced by the left-eye and the right-eye views is calculated as follows:
SCTL= L1kw – L1kk / L1wk – L1kk ,
SCTR= L2wk – L2kk / L2kw – L2kk ,
where Liwk is the view-i luminance measured with all white as left-eye source images and all-black as right-eye source images; Likwis the view-i luminance measured with all-black as left-eye source images and all-black as right-eye source images; Likk is the view-i luminance measured with all-black sources.
The level of SCT crosstalk on 3-D monitors with a pattern-retarder solution can drop below 1% with the appropriate selection of the key components in a stereo 3-D 24-in. medical display. The circular polarization induced in the emitted light is obtained by combining the linear-polarized light from the LCD panel and the quarter-wave retarder filter applied to its surface (Fig. 2). All the component materials from the LCD-panel technology (TN, VA, or IPS) and the process used to apply the filter play a relevant role in crosstalk minimization.21 The polarizer lenses play a crucial role in the final crosstalk and need to be matched with the LCD panel as well as the cross polarizer adopted in the display. For instance, the polarization axes of the light emitted from a conventional LCD panel can range from polarization axes of 0°, 45°, 90°, or 135°. In the case of a wrong combination between the 3-D monitor and the 3-D glasses, the level of SCT can easily go above the visibility threshold and it could introduce colored ghost images of purple/reddish coloration, as shown in Fig. 3.
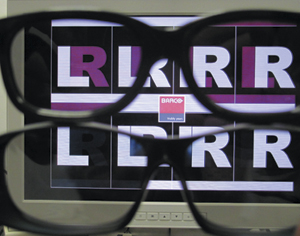
Fig. 3: Through the glasses at the top, a mismatch between the 3-D circular-polarizer glasses and a 3-D LCD monitor can be seen, and through the pair at the bottom, a correct combination can be seen.
Current 3-D solutions with line-interleaved cross-polarizer filters have a limited viewing angle in the vertical direction due to their intrinsic construction (the LCD pixel matrix and the cross-polarizer filter are positioned on different planes). The vertical sweet spot is improved by adding black stripes on the cross-polarizer filter among the display lines, but may result in brightness reduction and a more critical need for alignment (an error can introduce moiré visible when in 2-D mode). Viewers can move freely in the horizontal direction without losing the correct stereo viewing, while in the vertical direction a 3-D viewing angle of ±10° (3-D vertical sweet spot) is reached starting with a conventional 24-in. LCD panel.21 A specific design for a 3-D LCD panel will achieve a wider 3-D vertical viewing angle by reducing the thickness of the LCD front glass and utilizing new LCD cell structures with an embedded quarter-wave retarder and polarizer.
Theoretically, the vertical resolution of single left- or right-eye views is reduced, but, practically, the loss of resolution is not significantly noticeable. In fact, when a video signal is delivered in interlace format, the signal information present is intrinsically limited in the vertical direction (the Kell effect). Otherwise, full Nyquist high-frequency content can lead to visible line flickering or aliasing (as shown in Fig. 4); after a de-interlacing process22 for display on progressive LCD screens.
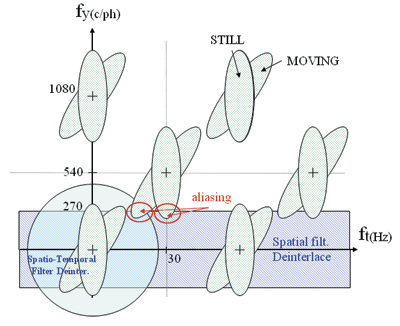
Fig. 4: Shown is the frequency spectrum of interlaced video signals.
Future Medical Applications
In terms of future applications, stereoscopic displays combined with 3-D echocardiography have been shown to improve the visualization of real-time ultrasound images, decreasing the time required for surgical task completion and increasing the precision of instrument navigation. Another potential application is the visualization of 3-D artery trees from angiography, MRI, or CT acquisitions. 3-D visualization in the coronary tree of the heart would have some benefit before an angioplasty because it would help to correctly estimate the degree of the stenosis. Other possible applications of new 3-D displays include use in anatomy teaching, treatment planning, stereo mammography, and for recent new modalities such as digital breast tomosynthesis.
In terms of the nearer future, there are several medical-imaging applications for which information is already available in the three-dimensional space: computer tomography, magnetic resonance, multi-projection X-ray, 3-D ultrasound, binocular microscopes, etc. Volumetric 3-D rendering is currently being employed on high-quality 2-D displays; this application could benefit from the new stereo 3-D display technology.
Challenges and Opportunities
Such technology will be introduced only after the required validation steps for diagnostic usage have been taken. A new quality metric must be defined and an example proposed. The assessment of image quality with respect to perception is still under development and no standards or well-accepted methods yet exist.
The potential is great; however, in applications involving the manipulation of a medical device during an image-guided interventional procedure, real-time stereo 3-D perception improves hand-eye coordination and enhances the comprehension of complex anatomical structures. For this reason, 3-D display technology is likely to find its next applications in procedures such as laparoscopy; neuro, spine, and ophthalmic surgery and cardiovascular procedures. Selection among the available 3-D technologies should aim first at minimizing visual fatigue and discomfort, taking into consideration the critical and continuous nature of the visualization tasks and at the same time providing the best image quality without artifacts. It is foreseen that the specificity of all the different medical tasks will lead not to one solution for stereo 3-D displays but to a number of displays tailored to meet particular objectives, as occurred with the range of 2-D medical displays currently in use.
References
1P. G. J. Barten, Contrast sensitivity of the human eye and its effects on image quality (SPIE Optical Engineering Press, 1999).
2S. Daly, "The visible differences predictor: an algorithm for the assessment of image fidelity," Digital images and human vision (MIT Press, Cambridge, 1993), pp. 179–205.
3J. Lubin, "A visual discrimination mode for image system design and evaluation" (E. Peli, ed.), Visual Models for Target Detection and Recognition (Singapore World Scientific, 1995), pp. 207–220.
4A. Benoit, P. le Callet, P. Campisi, and R. Cousseau, "Quality assessment of stereoscopic images," JIVP 659204, 1–13 (2008).
5P. Gorley and N. Holliman, "Stereoscopic image quality metrics and compression," Proceedings of SPIE Stereoscopic Displays and Applications XIX 6803(1), 680305.1– 680305, 12 (2008).
6A. Boev, A. Gotchev, K. Egiazarian, A. Aksay, and G.B. Akar, "Towards compound stereo-video quality metric: a specific encoder-based framework," Proceedings of IEEE Southwest Symposium on Image Analysis and Interpretation, 218-222 (2006).
7R. Patterson, A.S. Boydstun, J.A Rogers, and L.M. Tripp, "Stereoscopic depth perception and interocular luminance differences," SID Symposium Digest 40(1), 815–818 (2009).
8P. J. H. Seuntiens, L. M. J. Meesters, and W. A IJsselsteijn, "Perceived quality of compressed stereoscopic images: Effects of symmetric and asymmetric jpeg coding and camera separation," Journal ACM Transactions on Applied Perception 3(2), 95–109 (2006).
9W. D'Oosterlinck and C. Marchessoux, "New methodology for evaluating quality of stereoscopic images," SID Symposium Digest 41, 522-525 (2010).
10Z. Wang, E. P. Simoncelli, and A. C. Bovik, "Multi-scale structural similarity for image quality assessment," Proc. IEEE ACSSC 2, 1398–1402 (2003).
11Z. Wang, A. C. Bovik, H. R. Sheikh, and E. P. Simoncelli, "Image quality assessment: From error visibility to structural similarity,"IEEE Transactions on Image Processing 4(13), 143–152 (2004).
13I. P. Howard and B. J. Rogers, Binocular Vision and Stereopsis (Oxford University Press, Oxford Psychology Series, 1995).
14C. Marchessoux and T. Kimpe, "Specificities of a psychophysical test room dedicated for medical display applications," SID Symposium Digest 38, 971-974 (2007).
16ITU-R, Recommendation BT.500-10, "methodology for the subjective assessment of the quality of television pictures," Tech. Rept., ITU, Geneva (2002).
17A. Woods, "Understanding Crosstalk in Stereoscopic Displays," (Keynote presentation), 3DSA, Tokyo, Japan (2010).
18K. C. Huang, J. C. Yuan, C. H. Tsai, W. J. Hsueh, and N. Y. Wang, "A study of how crosstalk affects stereopsis in stereoscopic displays," Proceedings of SPIE Stereoscopic Displays and Virtual Reality Systems X 5006, 247–253 (2003).
19K. C. Huang, K. Lee, and H. Y. Lin, "Crosstalk issue in Stereo/Autostereoscopic Display," Proc. IDMC, 2–18 (2009).
20L. Chen, Y. Tu, W. Liu, Q. F. Li, K. Teunissen, and I. Heynderickx, "Investigation of Crosstalk in a 2-View 3-D Display," SID Symposium Digest 39, 1138–1141 (2008).
21Y. Yoshihara, H. Ujike, and T. Tanabe, "3-D Cross talk of stereoscopic (3-D) display using patterned retarder and corresponding glasses," Proc. IDW '08, 1135–1138 (2008).
22G. de Haan and E.B. Bellers, "Deinterlacing – An overview," Proc. IEEE 86, No. 9, 1839–1857.(1998).
23D. J. Getty, "Stereoscopic Digital Mammography," Proceedings of 1st Americas Display Engineering and Applications Conference, 11–14 (2004).
24D. J. Getty, C. J. D'Orsi, R. M. Pickett, M. S. Newell, K. R. Gundry, S. F. Roberson, and S. R. Bates, " Stereo mammography takes breast imaging to a new dimension," RSNA (2007).
25D. J. Getty, "An evaluation of stereoscopic digital mammography for earlier detection of breast cancer and reduced rate of recall," Clinical Trial Austalia – Novotech, The Australian CRO (2008).
26M. Carnec, P. Le Callet, and D. Barba, "An image quality assessment method based on perception of structural information,"Proceedings of IEEE Intl. Conf. on Image Processing (2003).
27J. Hakkinen, T. Kawai, J. Takatalo, T. Leisti, J. Radun, A. Hirsaho, and G. Nymana, "Measuring stereoscopic image- quality experience with interpretation based quality methodology," Proc. SPIE IS&T Electronic Imaging, 6808 (2008).
28J. Seo, D. Kim, and K. Sohn, "Compressed Stereoscopic Video Quality Metric," Proceedings of SPIE IS&T Electronic Imaging 7237, 12-1– 12-11 (2009).
29A. Kuijsters, W. A. IJsselsteijn, M. T. M. Lambooij, and I. E. J. Heynderickx, "Influence of chroma variations on naturalness and image quality of stereoscopic images," Proceedings of SPIE IS&T Electronic Imaging 7240, 0E-1 – 0E-9 (2009).
30L. Goldmann, F. De Simone, and T. Ebrahimi, "A comprehensive database and subjective evaluation methodology for quality of experience in stereoscopic video," Proceedings of SPIE IS&T Electronic Imaging 7526, 0S-1 – 0S-11 (2010). •
Luigi Albani is Technology Innovation Manager for BARCO Healthcare Division, FIMI S.r.l. Italy. He can be reached at. +39-02-96175 x348 or luigi.albani@barco.com. Cédric Marchessoux is Technology Innovation Project Manager for BARCO Healthcare Division, Belgium. He can be reached at +32-56-233-533 or cedric.marchessoux@barco.com. Tom Kimpe is responsible for worldwide research and innovation activities for BARCO's Healthcare Division. He can be reached at +32-56-233-385 or tom.kimpe@barco.com.