A General Framework for Measuring the Optical Performance of Displays under Ambient Illumination
A General Framework for Measuring the Optical Performance of Displays under Ambient Illumination
The growing diversity of the display landscape requires a unified approach to characterize visual performance under realistic lighting conditions.
by John Penczek, Edward F. Kelley, and Paul A. Boynton
AS displays continue to evolve while manufacturers seek to provide users with improved image quality and greater utility, there is a tendency for each manufacturer to develop measuring methods that are specific to each display technology, even for the same application. These disparate methods can make it difficult to compare performance among different display technologies. This is especially true when displays are characterized under ambient illumination, where display performance is often quoted for inconsistent lighting conditions.
For example, the ambient contrast ratio may be specified with a display at 200 cd/m2 under 500 lx of illumination. However, that lighting information is often insufficient for the user to confirm the performance or determine if it is applicable to their environment. The laboratory measurement may have been performed with a single light source, but typical indoor and outdoor illumination conditions have two or more lighting sources. And each of these light sources could have different illumination levels, spectra, and directionality. All this can affect how light is scattered to the viewer. Therefore, simply citing display performance at a specific illumination level and viewing condition is usually not sufficient to describe the range of use cases. A more systematic approach is needed to manage the complexity posed by the range of ambient illumination conditions that may be used.
The General Lighting Environment
Although a display may be viewed under a large number of lighting scenarios, the display’s ambient performance is typically evaluated by a common set of observed
photometric and colorimetric characteristics, which are largely independent of the display technology. From the optical-metrology perspective, the net photometric and colorimetric quantities measured at the observation point are usually indifferent to the source or multiplicity of the light. In addition, since the detectors employed to measure the light are fundamentally linear radiometric instruments, we can employ linear superposition to determine the magnitude of the optical signal from multiple light sources by summing up the individual contributions. However, it should be noted that the presumption of linear superposition in the detection of the optical signal does not mean that the human visual system is linear. Vision science has demonstrated that our perceived sense of brightness and color is sensitive to adaptation mechanisms.1
There are extensive vision models to simulate these mechanisms if more accurate perceptual results are necessary. However, these visual models still rely on the photometric and colorimetric data as inputs, which are taken by linear optical detectors. We can leverage the concept of linear superposition for luminance and spectral radiance (or absolute tristimulus values) to simulate complex lighting environments from individual source measurements.
Figure 1 illustrates the situation of a general display under arbitrary illumination. In the case of an emissive or transmissive display (e.g., OLED or LCD) in a dark room, the viewer only observes the emitted luminance (Lem) or color. If the display is observed in an illuminated room, or in daylight, the illumination from hemispherical diffuse (EF,hemi) and directional (EF,dir) light in front of the display would produce a net reflected luminance (Lr) that would add to the emitted light. And in the case of a transparent display, the illumination from hemispherical diffuse (EB,hemi) and directional (EB,dir) light in back of the display would produce an additional transmitted luminance
(Lt) to the viewer.
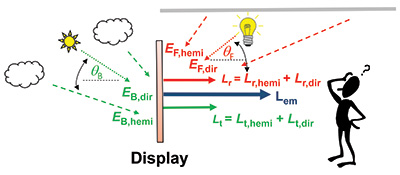
Fig. 1: This general viewing scenario of a display shows front- and back-illumination from hemispherical diffuse and directional light sources.
In general, the total luminance perceived by the viewer would be the sum of the three contributions (Lem + Lr + Lt). If a spectro-radiometer was used to measure the spectral signal at the viewer’s position, the total spectral radiance would add up on a wavelength basis. The spectral information could then be used to calculate both the luminance and color of the signal. This model can also be applied to a reflective display, which would only have a reflected contribution (Lr) if it was opaque.
The use of linear superposition in this model may appear simplistic, but as we will show shortly, the extension of this concept into the display metrology can yield valuable benefits. Our analysis will also assume that the focus of the viewer is on the display screen. In some situations, such as specular images or viewing objects behind transparent displays, the viewer’s focus may be at a different position. In those situations, the content on the screen will interfere with the off-screen image. We will, however, limit our discussion to the display’s on-screen performance.
When evaluating the performance of a display under ambient lighting conditions, there are numerous possible lighting configurations. However, for daylight conditions, there are two main light sources. The hemispherical skylight provides omni-directional illumination, and sunlight illuminates the display with rather directed rays. The illuminance levels from both of these components are a function of the display orientation, its position on the earth, the season, time of day, etc. The Illumination Engineering Society of North America (IESNA) has developed an empirical model to estimate the illuminance levels for both the hemispherical diffuse illumination of the skylight and directional illumination of the sunlight.2 However, the IESNA model does not provide color information, which is necessary to predict the resulting color. Alternatively, the National Renewable Energy Laboratory (NREL) in the U.S. has collected a substantial amount of spectral irradiance data for solar energy research and developed a spectral model for skylight and sunlight.3 Both of these daylight models were found to yield similar illuminance levels for the test cases we explored. But the spectral data available from the NREL model provides the complete information needed to calculate both luminance and color results.
Indoor illumination can be more varied than outdoor. There may be several luminaires (or directional sources) in a room, but we can consider there to be only one hemispherical diffuse source. The hemispherical illumination may originate from luminaire light that diffusely scatters off indoor surfaces or the light from windows. For the example shown in Fig. 1, we limited the indoor lighting scenario on the right side of the display to one luminaire. The relative amount of hemispherical diffuse to directional illumination on the screen depends greatly on the lighting conditions. However, for offices with windows, the hemispherical diffuse illumination originating from window light can be a dominant contributor.
A General Display Formalism
As suggested in Fig. 1, the luminance (or spectral radiance) that is measured at the observation point will be the sum of all the contributing light sources. This can be expressed mathematically by the expression in Fig. 2, where the contribution of each external light source can be represented by their front reflection (RF,hemi and RF,dir) and back transmission (TB,hemi and TB,dir) coefficients and their relative illumination levels. The geometric dependencies of the reflection and transmission coefficients on the light source and detector configuration have been omitted for simplicity. When the measurements are made in terms of photometric units (i.e., luminance), we refer to luminous reflection and transmission coefficients. The general equation can also be expressed in its spectral form, with equivalent spectral reflectance and transmittance factor distributions. The original concept was put forth by Kelley et al. to take into account ambient reflections, but has been recently generalized to
include transparent displays.4,5
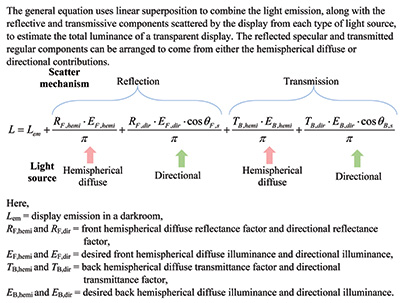
Fig. 2: The above represents the general formalism for simulating the ambient performance of displays.
The reflection and transmission coefficients are fundamental display characteristics that describe how light is scattered when measured at a given illumination and detection geometry. Displays will usually exhibit a linear response to the incident light, which means that the reflection and transmission coefficients will remain constant for typical levels of illumination. This invariance enables the reflection and transmission coefficients to be measured at modest illumination levels, and the general equation then allows the display luminance to be calculated at low or high illumination levels. The illumination scaling property yields even greater benefits when performing spectral measurements. In that case, the spectral reflection and transmission distributions can be measured with a convenient light source (e.g., tungsten lamp), but the reflected or transmitted spectra can be calculated for an ideal source such as CIE Illuminant D65. Using the spectral form of the general equation also allows us to calculate the effective color observed from the combined sources. The detailed methods for measuring the reflection and transmission coefficients are given elsewhere.6,7 However, we highlight the utility of this method by applying it to several lighting scenarios.
Applying the Formalism
We demonstrate the value of the proposed formalism by simulating the ambient performance of a commercial transparent 22-in.-diagonal TN-LCD panel under various application scenarios. A photograph of the pixel structure used by this LCD is shown in Fig. 3 with hemispherical diffuse white back-illumination. Since this is not an emissive device, the RGB color-filter array must be externally illuminated in order to be visible. The spectral distribution of that illumination will also impact the resulting color gamut of the device. Therefore, this structure is strongly affected by the illumination conditions.
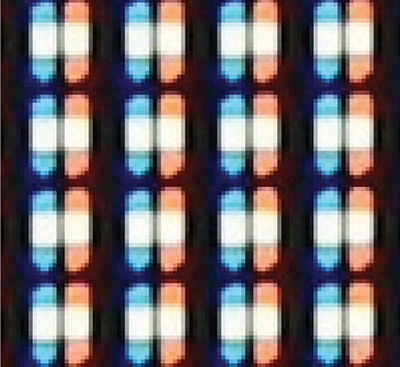
Fig. 3: The above close-up image of a transparent LCD pixel structure shows a rendering of a magenta color (green pixels off). This design uses a clear section in the middle of each subpixel.
The response of the transparent LCD to ambient illumination was characterized by using a white hemispherical diffuse light source (with specular included, di/0, detector at normal incidence) and a directional source at 45° inclination to the display. Since the periodicity of the active-matrix structure tends to induce diffractive scatter with discrete directional sources, a ring light source was used instead. These illumination sources were employed in front and back of the display to measure the reflection and transmission characteristics. In our tests, a spectro-radiometer was used in order to measure the spectral reflectance and transmittance factor distributions. This allowed us to accurately model the color response of the display to a variety of other (ideal) light sources. If photometric characteristics (e.g., contrast ratio) were of primary concern, then photometers could be used.
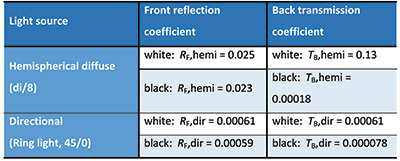
The measured front spectral reflectance factor distributions, for both hemispherical diffuse and directional illumination, were measured to be fairly consistent for the rendered red, green, blue, cyan, magenta, yellow, white, and black (RGBCMYWK) colors. However, the spectral transmittance distributions measured by back-illumination strongly depended on the rendered color. Figure 4 shows the measured spectral transmittance factor distributions for the transparent LCD with back-illumination from a hemispherical diffuse light source. The red, green, and blue distributions resemble the transmission curves for typical RGB filters. However, in this device design (see Fig. 3), each color subpixel has a clear middle section that transmits broadband light. Therefore, when the display is rendering a red color (for example), the measured spectral transmittance in Fig. 4 indicates that green and blue wavelengths are also transmitted. The spectral reflectance and transmittance factor distributions can be weighted by the photopic response of the eye and expressed as scalar values. The front luminous reflectance and back transmittance factor coefficients for the transparent LCD are summarized in Table 1.
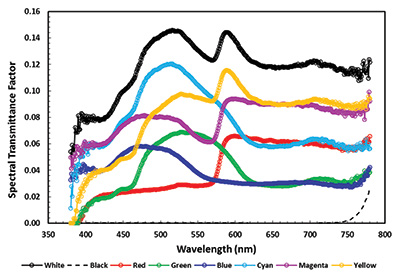
Fig. 4: Spectral transmittance factor distributions for the transparent LCD are measured with back-illumination from a hemispherical diffuse light source. The legend at the bottom indicates the color the display was rendering during the measurement.
Table 1: Reflection and transmission coefficients are used to evaluate the transparent LCD performance. Corrected to a CIE Illuminant D65 white light source.
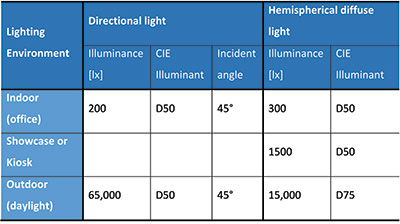
The performance of the transparent display was evaluated for the three ambient illumination environments listed in Table 2. The indoor and outdoor conditions replicate the ambient lighting conditions used by several standards.6,8,9 The showcase lighting conditions are typical of how transparent LCDs are currently used in point-of-sale situations. Note that the illumination level, geometry, and light-source spectra are specified in order to accurately represent the lighting environment.
Table 2: Ambient illumination conditions are shown for several lighting environments where transparent displays may be used.
The ambient lighting conditions were applied in four viewing scenarios. These scenarios are tabulated in Table 3 using the back/front notation to identify which illumination conditions are used in back and in front of the display, relative to the viewer. The indoor/indoor scenario simulates the lighting environment when the display is used in an office setting. The showcase/indoor scenario estimates the lighting conditions when the display is the front face of a lighted booth inside of a building. The outdoor/indoor configuration approximates the case when the display is mounted in a window, with the indoor viewer looking outside. And the showcase/outdoor setup simulates the situation where the display is a window to a storefront and the viewer is outside.
Table 3: Ambient optical performance of the test transparent LCD is measured in various viewing scenarios.
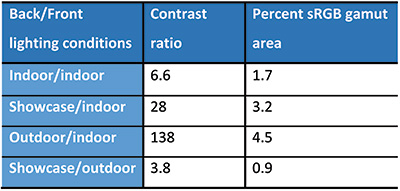
Each of the viewing scenarios listed in Table 2 was evaluated following the expression in the equation box, using the coefficients in Table 1 and the lighting levels in Table 2. The ambient contrast ratio can be obtained using the photometric form of the expression in the equation box. In this case, the color dependence of the transparent LCD transmission coefficients did not produce a significant impact on the ambient contrast ratio calculation for the illumination levels used in our scenarios. However, the actual spectral transmittance factor distributions were needed to determine the effective colors and, consequently the color gamut area. The color gamut area listed in Table 2 was calculated as the percent area covered by the effective ambient RGB colors on a CIE 1976 chromaticity diagram relative to the sRGB gamut area (see Fig. 5).
The previous example illustrated how the display ambient performance can be predicted by using the general model for the complex case of a transparent display. The simpler situation of a conventional opaque display can also be evaluated. We demonstrate this by only measuring the hemispherical diffuse and directional reflection coefficients of a commercial tablet display and evaluate the display indoor and outdoor performance using the illumination conditions given in Table 2. The contrast ratio and color gamut area for the tablet display at 200 cd/m2 is summarized in Table 4. The color gamut of the tablet display is also compared to the transparent LCD in Fig. 5.
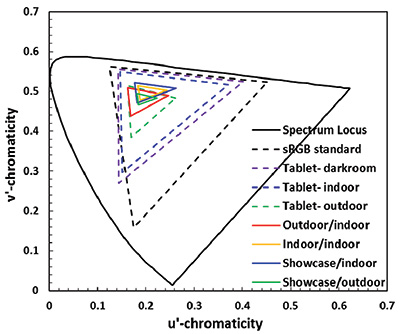
Fig. 5: The CIE 1976 chromaticity diagram illustrates the color gamut of the transparent LCD and tablet display under the various scenarios listed in Table 2.
Table 4: The ambient optical performance of a commercial tablet device with a 200 cd/m2 LCD is charted under the indoor and outdoor illumination conditions given in Table 2.
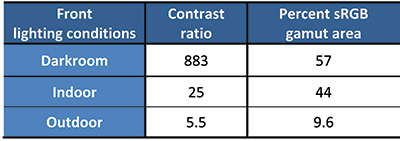
Table 4 illustrates the sharp reduction in the contrast ratio of the tablet display as
the illumination is increased to full daylight levels. It is interesting to compare this with the transparent LCD. In both cases, the contrast ratio is constrained by the reflected ambient light, which raises the black level. But the transparent LCD can utilize the high back-illumination levels to achieve on-screen contrast ratios that can sometimes exceed the tablet display under similar conditions. However, Fig. 5 illustrates that even the high back-illumination levels cannot substantially improve the relatively narrow color gamut of the transparent LCD. The clear mid-section of this subpixel design washes out the transmitted colors by allowing broadband light through the color-filter array and severely limits
the display’s color gamut. Other transparent LCD designs have since been introduced and are expected to have significantly better performance. Transparent OLED displays are also expected to enter the market. The proposed methodology is capable of fairly evaluating either of these technologies.
This example illustrates how the new generalized framework for display ambient performance can be used to simulate many lighting scenarios from a basic set of
reflection and transmission measurements. By framing the analysis in terms of the intrinsic reflection and transmission characteristics of the display, we can estimate the display performance without physically assembling and measuring the actual lighting environment. Since some lighting scenarios can be complex, with special spectra and high illumination levels, they are difficult to replicate and tend to produce unstable measurements. The linear superposition concepts employed in our method breaks that paradigm in favor of simple well-controlled transmission and reflection measurements with single light sources. This approach will yield reliable measurements that can be applied more broadly than legacy methods.
References
1G. Wyszecki and W.S. Stiles, Color Science: Concepts and Methods, Quantitative Data, and Formulae, 2nd ed. (John Wiley & Sons, 2000).
2The IESNA Lighting Handbook: Reference and Application, Illumination Engineering Society of North America, 9th ed. (2002).
3ASTM G197-08: Standard table for reference solar spectral distributions: Direct and diffuse on 20° tilted and vertical surfaces (2012).
4E. F. Kelley, M. Lindfors, and J. Penczek, “Display Daylight Ambient Contrast Measurement Methods and Daylight Readability,”
J. Soc. Info. Display 14, 1019–1030 (2006).
5J. Penczek, E. F. Kelley, and P.A. Boynton, “General metrology framework for determining the ambient optical performance of
flat panel displays,” SID Digest of Technical Papers 46 (2015).
6International Committee for Display Metrology (ICDM), Information Display Measurements Standard (IDMS), ver. 1.03, section 11 (2012);
http://www.icdm-sid.org/.
7J. Penczek, E. F. Kelley, and P. A. Boynton, “Optical measuring methods for transparent displays,” SID Digest of Technical Papers 46 (2015).
8IEC 62679-3-1 Ed1.0 Electronic paper displays - Part 3-1: Optical measuring methods, International Electrotechnical Commission, April 24, 2014.
9IEC 62341-6-2 Ed1.0 Organic light emitting diode (OLED) displays - Part 6-2: Measuring methods of visual quality and ambient performance, International Electrotechnical Commission, Jan. 24, 2012. •
John Penczek is a Senior Research Associate at the University of Colorado, Boulder, Co, and at the National Institute of Standards and Technology, Boulder, CO. He can be reached at jpenczek@nist.gov. Edward Kelley is a consulting physicist at KELTEK, LLC. Paul Boynton is an Electrical Engineer at the National Institute of Standards and Technology, Gaithersburg, MD.