Advanced Imaging Colorimetry
Advanced Imaging Colorimetry
Implementing advanced methods of display metrology enables highly accurate luminance and color-imaging measurements to be performed. The next generation of high-accuracy imaging colorimeters benefits from a combined approach of recording additional data and utilizing a matrix-based optimization algorithm.
by Đenan Konjhodžić, Peter Khrustalev, and Richard Young
A colorimeter comprises at least three opto-electrical detectors, each in combination with a filter to match the overall spectral sensitivity of these combinations to those of the CIE 1931 color-matching functions. The electrical output of each of these color channels is proportional to the tristimulus values X, Y, and Z. When the detectors deliver output signals according to the sum of the light intensity across the field of measurement, the device is called a “spot”-meter. When two-dimensional arrays of detector elements are used instead – again in combination with appropriate filters – a corresponding array of area elements on the object of measurement can be analyzed with respect to luminance, Y, and chromaticity, e.g., x, y.
Instruments of the latter type are called imaging colorimeters because the color channels can analyze the surface area of objects and scenes and generate data
arrays (of luminance and chromaticity levels) just like cameras deliver RGB images. The detector arrays can be provided with color filters on the individual
elements (e.g., RGB filters) or a filter wheel with at least three filters can be in front of the array for time-sequential color analysis, usually in terms of the tri-stimulus values X, Y, and Z. Imaging colorimeters also require a suitable optical system for projection of a region of the surface of the object of measurement through the filters on the detector array. Imaging colorimetry has gained popularity due to its convenience and potential for making sophisticated automated analyses.
Instruments for colorimetric analysis via spectral measurements (spectral power distribution) are currently of the spot-meter type, so they have to be carefully aligned in order to make sure that the field of measurement is correctly positioned on the object to be measured. Incorrect positioning can cause severe measurement errors, especially in the case of objects with complicated display structure and layout (e.g., automotive dashboards and displays). Such complex display devices can be analyzed much more easily with imaging colorimeters because the actual colorimetric analysis can be performed after recording of the image, and identification of the regions of interest can be automated. This ease of use is the motivation for development and implementation of techniques that increase the precision of colorimetric analysis for arbitrary spectra as described in this article.
Objective and Background
The measurement accuracy of imaging colorimeters crucially depends on the quality of the optical filters in use. Enhancing the fit of the filters with the human eye’s color-matching functions (CMFs) improves the accuracy of the measurements. As a result of the unavoidable spectral mismatch of the colorimeter response
functions relative to the CMFs, the accuracy of measurement varies with the spectrum of the device being tested.� Usually three filters are used, one for each CMF. More advanced devices use four filters, since one of the CMFs exhibits two disjunctive spectral regions that can be more accurately matched with two filters. In technical terms, even the best filters available will still not perfectly match the corresponding CMF, and this will inevitably generate measurement errors, most prominently at both ends of the spectral range of human vision. One approach to improving results is the use of additional filters to collect more information in these spectral regions. However, simply extending the number of filters, i.e., the number of data-acquisition channels, will not necessarily improve
measurement accuracy. A negative side effect is the significant increase in the measurement duration with the number of filters in use.
Measurement accuracy will increase according to the spectral match of the device under test and of the calibration source. Since calibrations are frequently made using white incandescent sources, LEDs and colored sources often create large errors in measurement. Matrix correction methods are used to correct display measurements and reduce such errors. There are generally three primaries of the display that are mixed to give the test color, and hence there is a limited variation in spectra. The matrix method of correction� is now commonly applied to such measurements, but it cannot be used if the spectrum is completely unknown. Matrix methods can still be applied to improve results in specific cases.
Here, we present a combined approach for extending the number of color filters from four to six, together with advanced matrix-based optimization methods. A matrix operation can derive the three tristimulus values from the six measurement values. This correction matrix can be optimized across a large set of sources so that no inherent assumption of spectrum is required. Only combining both methods yields more accurate results for practically all sources compared to standard methods of today. This article develops the theoretical proposals given as references� to include practical implementation and performance tests of actual devices. The goal of this work is to produce a better colorimeter that also works well when you need to measure an arbitrary or unknown spectra source.
Optimizing Spectral Responses
Color-matching functions, which form the basis for most measurements of color
quantities, are shown in Fig. 1 as solid lines. A typical colorimeter aims to reproduce these spectral response functions using a combination of filters and detectors, and although the match can be close, it is never exact. An example of a four-filter colorimeter is shown as dashed lines in Fig. 1. The CIEx color-matching function is realized using two channels on the colorimeter (X1 and X2) for the two peaks. This example shows that regions of mismatch occur around specific wavelengths. Significant errors are expected for such sources because LEDs may have narrow-band emissions in these regions.
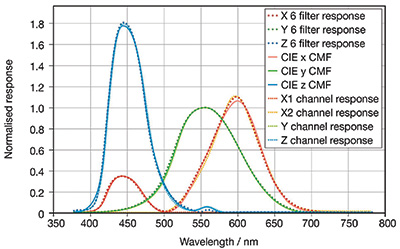
Fig. 1: Color-matching functions and examples of implementation appear in the above chart. CIE CMFs are solid lines; four-channel colorimeter examples are dashed lines; and six-filter colorimeter examples are dotted lines.7
Combining the channels is one way of improving the match. However, if the response is improved in one region, the response in another region is likely to be worse. There are many possible optimizations and each depends on the spectrum of the source to be measured. The source spectrum is generally unknown, so a compromise combination is required that minimizes the errors from each source.
Adding a 5th or 6th channel greatly increases the possibilities for optimization
and reduces dependence on the source spectrum. Figure 1 provides an example of using six channels to conform with the CIE CMFs more exactly. The match here is dramatically improved in both the 530- and 560-nm regions. This can be represented mathematically by a matrix product of six channel responses with a 3 × 6 adaptive matrix M of factors for the combinations of channels resulting in three tristimulus values.
The response of these extra channels would typically be single peaks at appropriate wavelengths to correct errors in the other four channels, but this is not a strict requirement. Narrow-band responses may introduce local corrections but be of limited general use. The optimum responses of these extra channels should therefore be matched to the errors in the basic four channels. It is useful to look at color errors for general matching.
Color-difference vector plots, such as those shown in Fig. 2, illustrate the errors with vector arrows and this conveys an immediate visual impression of distinct characteristics. The true co-ordinates (measured using a high-quality spectroradiometer for real sources or calculated for simulated sources) are shown as circles and the colorimeter-measured coordinates are at the tip of an arrow originating in the circle. The length of the arrow indicates the magnitude of the error and the direction of the arrow gives the direction of change. The arrows are too short to be seen clearly for use in quality systems, so they are magnified by a scaling factor to highlight the differences. For example, the vector scale is 3 in Fig. 2 and displays the arrows three times longer than they actually are. When comparing errors, the shorter the arrow the lower the error.
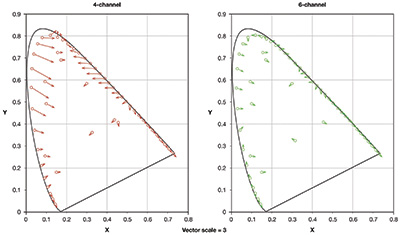
Fig. 2: Shown are color-difference vector plots in the CIE 1931 x,y color space illustrating the errors in the measurement of various sources using four- (left) and six-channel (right) imaging colorimeters. The vectors point from the true value to the measured value reported by the instrument. The vectors are enlarged by a factor of 3 to improve visibility.7
The sources represented in Fig. 2 include real and simulated sources. A set of 20-nm FWHM Gaussian distributions represents pseudo-monochromatic sources such as LEDs. In the CIE diagram, these are located around the outer edges close to the mono-chromatic locus. A further set of 20 colored and white LEDs plus four white and filtered incandescent sources are included. These are distributed at the edges and toward the middle of the diagram.
There is a clear general improvement resulting in lower errors for all sources when going from a four-channel to a six-channel colorimeter. The only limitation is that those spectral components lying beyond the wavelength range of the filters cannot be corrected in this general way so the errors are the same for both systems. The color-difference vector plots in Fig. 2 are calculated by least-squares optimizations to the CMF spectra and as such they are perhaps the most general. However, this requires knowledge of the spectral responsivities of each channel.
Optimizing Color Errors between Sources
If specific types of spectral sources are anticipated in the measurement, typical sources can be used (a training set) to minimize errors across the set. This procedure no longer requires knowledge of the spectral responsivities of the channels, but instead the tristimulus values of the training set must be known. The optimization can be for any specific derivative color space or output quantity, e.g., CCT or x,y color coordinates.
The training set should represent the typical variation in measured sources, such as those shown in Fig. 3. An entire spectral range needs to be covered and several white sources included. Figure 4 shows an example of measurements for which a training set of three white and 16 colored LEDs was used. After completing the calibration and application of matrix optimization for x,y color coordinates, the training set is used for verification. The diagram shows that color-coordinate deviations Δx and Δy are below 0.005 for all LEDs. Improved all-round performance is obtained for the whole set.
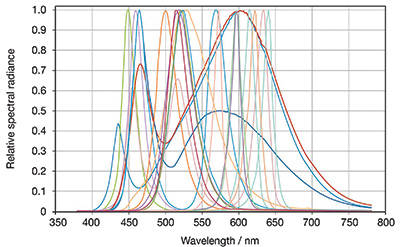
Fig. 3: Above are spectra of three white and 16 colored LEDs used as a training set covering the entire spectral range. The spectra are measured with a spectroradiometer and provide precisely determined x,y color coordinates as references for matrix optimization.
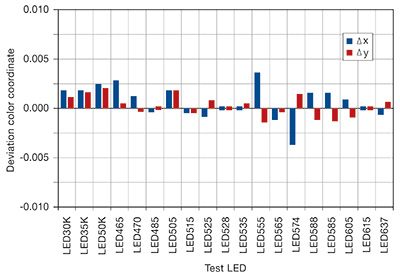
Fig. 4: The chart shows color-coordinate deviations of test LEDs for measurement with a six-filter imaging colorimeter.
The higher accuracy of the optimized six-filter imaging colorimeter for determining the color coordinates is also reflected in the calculation of the dominant wavelength, as shown in Fig. 5.
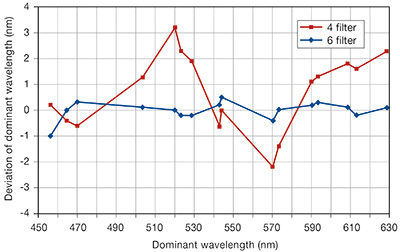
Fig. 5: The chart shows a comparison of deviations in the dominant wavelengths for different test LEDs for four-filter (red) and six-filter (blue) imaging colorimeters.
It is important that the training set includes all the required sources to be measured. However, some sources might be considered more important than others in terms of accuracy, and this can be accommodated using weighting factors in the optimization.
Obviously, there can be as many adaptive matrices as there are output parameters, so each can be individually optimized. However, if this is the case it should be noted that measurement results obtained with different optimization matrices are no longer related by normal transforms and cannot be interconverted.
Practical implementation requires the chosen matrix to be robust and stable during normal use so that multiple matrices are avoided, depending on conditions or the display being measured. Figure 6 shows that the matrix can be used at different distances, indicated by the measurement points plotted close to the “equivalence” line. Although each lens used has its own matrix, they all give equivalent results. Similar analyses of temperature changes and f/number changes show they too exert a generally insignificant effect. Results on different systems show close correlation with those obtained using a quality spectroradiometer.
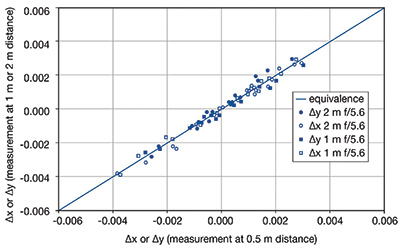
Fig. 6: Shown are equivalence plots for use at different distances for a wide range of white and colored incandescent sources and LEDs.
Study of Different Test Sources
Another study was made consisting of 22 samples, including LEDs and filtered incandescent sources that were not included in the training set. Each source was measured using a high-quality spectroradiometer as a reference and a colorimeter possessing the basic four filters (normal) or six filters (advanced). The six-filter system was optimized for minimum x and y differences.
Figure 7 shows the results of the study as color difference vector plots. Note that the vector scale is 10 to clearly show the errors involved. Although white sources are accurately measured with the four-channel system, colored sources give large errors. In contrast, the errors for all sources are small using the six-filter system.
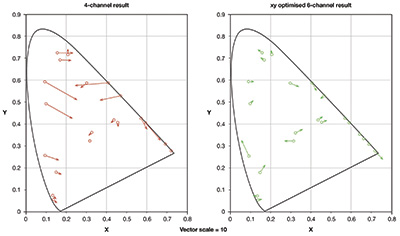
Fig. 7: Final study results show a four-channel filter (left) and six-channel optimized systems (right).
The Case for Colorimeters
The convenience of imaging colorimeters for performing complex characterizations of displays has made it the technology of choice in many applications. However, the accuracy of color and luminance values obtained has limited their reliability. The study has demonstrated that a six-channel imaging colorimeter utilizing a
matrix-based optimization algorithm gives a significant accuracy improvement compared with traditional three- or four-channel systems. The colorimetric accuracy of this method approaches that of high-quality spectroradiometers while maintaining the benefits of imaging technologies.
Optimization of the adaptive matrix can be generalized for all sources by a least-squares fit to CIE color-matching functions. This optimizes the effective responsivity of the system and does not require prior knowledge of the source to be measured. However, it does necessitate knowledge of the channel spectral responsivities.
Nevertheless, if knowledge of the tristimulus values for sources is available, the adaptive matrix can be optimized to a specific output parameter, e.g., CIE color coordinates x and y. The spectral responsivities of channels are no longer required. Optimization using a training set and a target algorithm will generally reduce errors inside the wide range of the training sources. Optimization can include weighting if some sources are more important than others in terms of accuracy.
This study of 22 samples, including LEDs and incandescent sources, verified the benefits of using an advanced (six channel) instead of a normal (four channel)
imaging colorimeter.
References
1J. J. Jensen, “Advantages and Applications for the Use of Imaging Colorimeters” Proc. CORM Conference (2013).
2G. P. Eppeldauer, “Spectral Response Based Calibration Method of Tristimulus Colorimeters,” J. Res. Natl. Inst. Stand. Technol. 103, 615, (1998).
3Y. Ohno and J. E. Hardis, “Four-Color Matrix Method for Correction of Tristimulus Colorimeters,” Proc. IS&T Fifth Color Imaging Conference, 301–305 (1997).
4J. D. Schanda and Z. T. Kosztyán, “Industrial colorimetry with image resolution,” Proc. Bulg. Color Conference, 1–5 (2008).
5Z. T. Kosztyán, G. P. Eppeldauer, and J. D. Schanda, “Matrix-based color measurement corrections of tristimulus colorimeters”, Applied Optics 49, 12, 2288–2301 (2010).
6R. Young and J. Neumeier, “High accuracy imaging colorimetry,” CIE x039:2014, 461–469 (2014). •
Đenan Konjhodžić, Peter Khrustalev, and Richard Young are with Instrument Systems. Đenan Konjhodžić can be reached at konjhodzic@instrumentsystems.com.