Understanding the Requirements for Automotive Displays in Ambient Light Conditions
Understanding the Requirements for Automotive Displays in Ambient Light Conditions
Understanding the Requirements for Automotive Displays in Ambient Light Conditions
Optimizing vehicular displays for the ambient light conditions they will be used in – from dark nights to sunny days and everything in between – requires a delicate balance of settings based on carefully obtained metrics.
by Jan Bauer and Markus Kreuzer
IN recent years, graphical display systems in automotive instrumentation and information systems have progressively replaced conventional gauges, lights, and switches, adding new levels of human–machine interaction. However, in conditions such as bright sunlight or changing ambient light, it can be highly challenging to ensure good legibility as well as a high-value perception of the displayed information on the part of drivers.
At night, display legibility is generally no problem. “Brilliance,” as a result of a complex combination of contrast, black-state uniformity, luminance, color gamut, dynamic range, and the quality of the content itself, is the most important goal. In daylight, drivers encounter a high dynamic range of ambient light situations varying from diffuse to direct (directional) light conditions. Guaranteeing legibility of important and relevant information on the display device is then the most critical task. In such cases, the perceived luminance contrast is the crucial and relevant quantity. This is determined by the light conditions, the reflection and scattering behavior of the display, the luminance of the display, and, of course, by the content itself.
Figure 1 shows a typical light condition of a type that can cause severe legibility
problems. The luminance of a cloud can reach up to 20 kcd/m² in peak luminance.
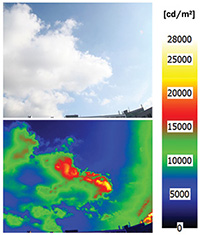
Fig. 1: At top is an image showing a typical ambient light situation for a partly cloudy day. At bottom is the corresponding false color image of luminances.
Such a situation, reflected on an untreated glossy glass surface (reflection ratio 4–5%) will lead to a reflected image with a luminance of up to 1000 cd/m². If we consider that for reference – a maximum luminance of a good automotive display is in the range of 500–800 cd/m² – then guaranteeing legibility is a severe problem.
However, before going into detail, we need to understand the concept of “Illumination” and its consequences for automotive displays. In common use, illumination of objects (that are not self-emissive) within an environment will cause those objects to appear brighter depending on their reflectivity. However, quantifying this illuminance using the traditional measure of Lux (lx) is only useful if we consider a perfectly diffuse homogeneous illumination source from all directions or if the objects are nearly perfect Lambertian scatterers (scattering the light homogenously in all directions). In all other cases, the area of the light source as well as the direction of light incidence and observation direction are highly important.
Modern display surfaces are rarely Lambertian scatterers, and highly glossy surfaces are preferred. For such typical, only slightly scattering surfaces, it can be shown that only a light incident within a cone having an apex angle of about 20°–30° around the reflected viewing direction (see Fig. 2) will have a significant influence on the appearance of the display content. Therefore, looking at the luminance distribution of diffuse light sources itself (e.g., clouds and sky as seen by an imaging photometer in Fig. 1) provides more insight than does looking just at the illuminance level. Only extreme bright point-light sources such as the sun (direct sunlight) have to be considered in more detail, and, here, illumination level and the illumination/observation geometry have to be analyzed very carefully. Table 1 provides an overview of typical automotive ambient light conditions.
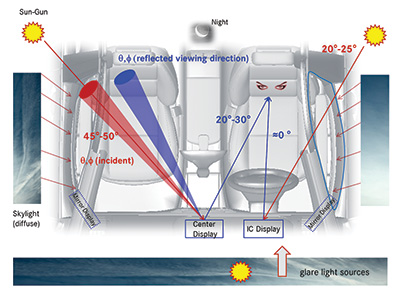
Fig. 2: This schematic visualization of ambient light conditions and in-car geometries helps demonstrate that the most critical situation would arise if the specular reflection of direct sunlight falling onto the display surface reaches the observer‘s (driver‘s) eye. As a design rule, the driver’s blue viewing cone, representing the (reflected) viewing direction with an apex angle of 5-10°, should not leave the interior of the car. Consequently, the red cone, representing the most critical situation of direct sunlight hitting the display, should not overlap with the blue cone.
Table 1: Several typical automotive ambient light conditions are shown.1 Lg is the luminance of the light source itself if we can consider it as an area light source (diffuse illumination). If we consider the effects of point light sources, then the illuminance Ei and the angle of incident and observation are crucial parameters that affect legibility and image quality. Average glare light sources are the result mainly of area light sources (road surface/buildings/sky) seen through the front windshield and resulting in veiling glare.
| |
Lg (cd/m2) |
Ei (lx) |
| Direct sunlight |
– |
2k – 100k |
| Cloudless sky |
1.4 – 4.4k |
|
| Cloudy |
6k – 20k |
500 – 10k |
| Rain |
40 – 500 |
50 – 1.3k |
| Twilight |
0.8 – 400 |
3 – 500 |
| Night |
0.05 – 10 |
0 – 50 |
| Average glare light source |
1k – 5k |
— |
To determine the influence of ambient light conditions affecting the perception of display content on in-car displays, we have to differentiate between two
phenomena:
• Specular reflected light and scattered light from display surfaces and inner structures of the display itself (touch sensors, electrode structures, etc.)
• Veiling glare in the eye of the display observer from the stray-light effect caused in the lens and vitreous body.
The contribution from the first phenomenom comes from the internal and surface properties of the display, the direction of incident light onto the display,
and the corresponding direction of observation; hence, it depends on in-car geometry (e.g., location of side windows) as well as on the position and orientation of the display. Figure 2 schematically shows a typical automotive situation with in-car geometry and ambient light conditions.
The reflected and scattered light results in an effective luminance Lr that adds up as background to the luminance distribution of the display content and hence reduces contrast and color gamut. For well-made geometric designs and highly optimized displays, it is possible to keep the reflected luminance Lr in critical situations below a critical value of 50–200 cd/m².
The second phenomenom is a result of the surrounding luminance (Lg, e.g., represented by a glare light source – see Table 1) that is scattered in the lens and the vitreous body of the human eye (Fig. 3). This scattered light, called veiling glare Lv, is superimposed with the image that the observer is looking at, e.g., the display in the car. This superimposed light then influences the vision of the viewed object. For typical car geometries, a veiling glare of around Lv = 30–35 cd/m² is quite typical on a bright, sunny day with an average glare light source of Lg = 2–3 kcd/m² (for details see also Fig. 10).
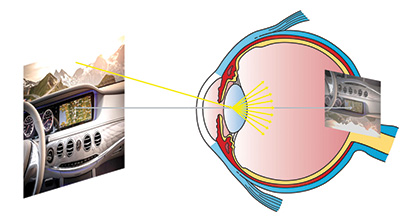
Fig. 3: This visualization shows the veiling-glare effect. The observer is looking at the display (gray arrow). The light of the sun (yellow arrow) that is visible behind the windshield is scattered in the eye. Due to the scattering, the light is distributed onto the retina, leading to an additional luminance (veiling glare) that then causes a change in perception (e.g., contrast reduction) of the display in the car.
As mentioned previously, the legibility of important and relevant information shown on the display device is most crucial under critical illumination conditions, and therefore the contrast ratio of such information should not fall below a certain value. The ISO norm (ISO150082) provides the specific light conditions, and, accordingly, the corresponding criteria for the minimum contrast ratio Cr of relevant information:
• Cr ≥ 5:1 during night time,
• Cr ≥ 3:1 during diffuse day-time illumination,
• Cr ≥ 2:1 at direct-sunlight conditions.
The authors have evaluated the ISO15008 standard and concluded that the provided light situations as well as contrast definitions outline a valid approach. Nevertheless, the ISO15008 does not cover the aspect of the veiling glare, so extra care has to be taken when designing display hardware and car geometry. This includes the content shown on the display as well as the dimming procedure of the display.
Perception of Display Content in Ambient Light Conditions
Under bright ambient light conditions – due to the reflected light and the veiling glare – further luminance is added to the display‘s luminance. With this additional luminance, the perceived optical performance of the display differs from the dark room conditions that are generally used in the specification of display parameters. The differences primarily result in three effects:
I Degradation of the visible gray-level differentiation
II Reduction of the visible contrast
III Reduced perceived color gamut
The dark room conditions are represented in Fig. 4 by the green lines and curves. The effect due to the additional light (EA) is shown by the red lines and curves. We used sample data to illustrate the effects.
The gray-level degradation appears in Fig. 4 (left). The green solid line shows the linear perception of the gray values without ambient light. In general, the perception of light is a complex non-linear relationship. A display compensates for this with a non-linear gray-value representation (often called gamma-correction). In ambient light, the additional light is superimposed with the non-linear
luminance of the gray levels. In combination with our non-linear perception, this results in a reduced differentiation of especially the low gray values, as shown by the red dotted line in Fig. 4 (left).
The definition for the contrast ratio of a display is the ratio of the intended bright data luminance divided by the value of the background luminance at the
same location. Simply put, how many times brighter is the intentional bright information than the unintentional background luminance? The smallest value of this ratio is 1:1 and at that value the display is undiscernible. With added ambient light, the background luminance is relatively more affected than the intended bright data luminance. Hence, the perceived contrast is significantly reduced, as shown in the red dashed curve in Fig. 4 (center).
For dark surroundings, the color gamut is spanned by the RGB primaries of the display, represented by the green triangle in Fig. 4 (right). The superimposed ambient light shifts those color primaries into the direction of the color coordinates of the ambient light, and hence reduces the perceived color gamut as represented by the red dashed triangle. The result is a reduction of the color contrast and is visible as a washed-out picture with a less brilliant display experience.
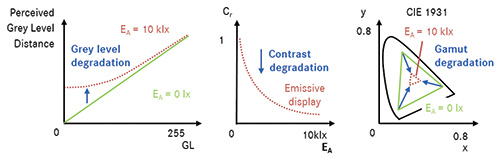
Fig. 4: Examples of the influence of ambient light to the perceived gray values are shown at left (8-bit example); center (contrast); and right (primary color gamut). Due to the added ambient light (EA), the gray values do become less distinguishable, the perceived contrast is reduced, and a color shift in the direction of the ambient light color coordinate occurs (sample data). The ambient light EA = 10 klx is used for an illustration of the ambient-light effects, which is approximately the effect on a cloudy day. For an accurate consideration of the in-car ambient-light situation, more data, e.g., the direction of the light, has to be considered.
Beyond the effects that happen in bright ambient light, the impact of dark ambient light conditions on the perception of the display and its content also have to be considered. Here, the effect of low light adaptions of the human visual system generally results in two disadvantageous effects:
I Disability glare
II Whitening of the display’s true black appearance
The disability glare (I) can be caused by a too bright display and/or in connection with an unsuitable light-colored graphical user interface (UI). The total emitted light from the display results in veiling glare that affects the outside view and may impact driving abilities. This effect is often seen with aftermarket navigation systems or smartphones when used during nighttime driving.
To minimize disability glare, suitable UIs for nighttime driving often make use of “black” as a background color in an extensive way. However, limited contrast of LCDs, restricted black uniformity, and sometimes too-bright display settings lead to a low-quality gray appearance (II) when compared to the dark environment of a car interior.
Passive Optimization of Specific Automotive Display Parameters
During nighttime driving, maximum contrast ratio (Cr), color gamut, and an appropriate UI design will dominate the display quality. Here, OLED displays and in future HDR displays would make a great difference. Meanwhile, we still have to deal with LCDs and should try to optimize the situation as mentioned above.
Well-made UIs for nighttime driving usually consist of an on-pixel-ratio (OPR) ranging from about 5% (classical UI for entertainment and comfort functions) up to 20% (for full-area navigation maps). Here, the OPR is defined as the sum of the luminances of all display pixels, divided by the number of pixels in relation to the luminance of a white screen.
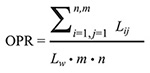
where Lij is the luminance of an individual pixel i,j of a display with m × n pixels defined by
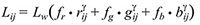
where Lw is the maximum luminance of the display, g is the gamma correction factor (typically g = 2.2 for automotive displays) and rij, gij, and bij are the normalized gray level of the red, green, and blue subpixel ij. The weighting factors fr, fg, and fb depend on the color gamut (fr + fg + fb = 1) and account for the different contribution of the red, green, and blue pixel to the total luminance.
From customer studies, we know that dimming the luminance of the display to a maximum value of Lnight ≈ 150 cd/m² for an OPR of 5% results in the best compromise between brilliant content and optimized black-state perception while avoiding annoying disability glare. Since the dynamic range of OPR of the complete UI is quite large (at a maximum OPR = 20% the optimized dimming luminance should be around 40 cd/m²), one has to find a good compromise for luminance settings or apply an OPR-dependent global dimming of the display. For a careful evaluation, one has to take into account that the disability glare
is certainly dependent on the size of the display. In any case, manual setting of the maximum luminance should allow the driver to regulate the maximum luminance according to his preferences.
However, for an ideal ergonomic situation, we have to consider one more important point that relates to the structural integration of the display itself: By means of mounting measures and/or use of light-control films, one should avoid creating distracting reflections of the display content in the windshield and possibly in the side windows.
In daylight conditions, the situation becomes far more challenging. The reflected and scattered ambient light results in an effective luminance Lr that adds up as background to the luminance distribution of the display content and hence influences the legibility and value perception in a crucial way.
The typical in-car situation during day-time driving can be effectively divided into two typical cases: (a) diffuse daylight and (b) direct sunlight condition.
The SAE 17571 gives a good representative illumination and measuring setup for both typical automotive cases:
• Diffuse daylight: Lr = Ldiffuse as result of an omnidirectional light source illuminating the display surface with an illuminance E = 5 klx.
• Direct sunlight: Lr = LSunGun as result of a directional light source with a luminous power E = 45 klx incident on the surface of the display.
As mentioned above, the ISO150082 defines the legibility criteria for daylight contrast ratios as Cr.diffuse ≥ 3:1 and Cr,SunGun ≥ 2:1 for all relevant information shown on a display.
However, much more interesting is the question of what conditions must be fulfilled – in terms of content creation and display properties – to ensure such requirements. To give a general answer, we consider the following points and argumentations:
1. Relevant information (text, symbols) in modern UIs is designed to fulfill the nighttime condition Cr.night ≥ 5:1 and make use of the full available range. Typically, such information is designed in the same way for day and night-time operation (while other background information and, e.g., maps might be different).
2. Analyzing many such typical modern UIs, we derived the understanding that to fulfill the ISO15008 criteria Cr,SunGun ≥ 2:1, the display needs to fulfill the requirement for the maximum possible contrast (black/white contrast) in direct sunlight conditions as
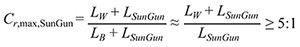
where LW is the maximum luminance and LB the minimum luminance of the display itself. It is then straightforward to show that this is equivalent to the requirement
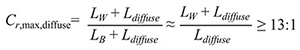
for diffuse daylight conditions (Cr.diffuse ≥3:1).
At a diffuse omnidirectional illumination with E = 5 klx, the reflected luminance can be derived as Ldiffuse = 5000/π × Rsci (cd/m²) by measuring the reflectivity Rsci of the display (diffused illumination, 8° viewing angle, sci: specular component included) as defined by international standards CIE No. 15, ISO 7724/1, DIN5033 Teil7, ASTM E 1164, and JIS Z 872.
Following this line of argumentation, we can easily derive a direct relationship between the reflectivity Rsci and the required maximum luminance Lw of the display as shown in Fig. 5.
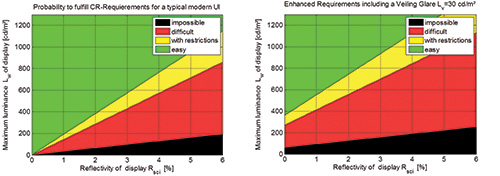
Fig. 5: The charts show the relationship between the required maximum luminance Lw and reflectivity Rsci of the display in ambient daylight conditions (E = 5 klx omnidirectional). The colored areas show the probability of fulfilling the legibility criteria for typical modern UIs. The green area (yellow area) corresponds to Cr,max,diffuse ≥ 13:1 (>10:1) respectively, Cr,max,SunGun ≥ 5:1 (> 4:1). In the left chart, we reflect the situation according to the legibility criteria of ISO15008. In the right chart, we have included the effects of a typical veiling-glare value Lv = 30 cd/m².
For a typical display without any anti-reflection coating (AR) or low-reflection coating (LR), the reflectivity is usually around 4%, requiring a display with a
maximum luminance of 600–800 cd/m². While this is quite challenging, especially if one considers that this luminance must be seen from the observer‘s position, it also shows that the situation improves dramatically using high-quality AR coatings (Rsci < 2%).
Whereas the diffuse daylight situation results in a straightforward relationship between overall reflectivity and maximum luminance of the display, the situation is more complex in direct sunlight. The additional luminance Lr = LSunGun perceived by the observer is strongly dependent on the geometry of the incident light direction, orientation of display, and the position of the observer. Therefore, we have established a very simple experimental method to determine the reflective scattering properties of a display with a single measurement, which can be used to analyze the situation as a function of the aforementioned parameters. Figure 6 shows the schematic setup of the experimental apparatus. The display is illuminated with a directional light source of E = 45 klx incident at θ = 45° with respect to the display surface normal. By using an imaging photometer with a conoscopic-lens setup, one can easily determine the scattering amplitude Lr = LSunGun as a function of observing position and display orientation.
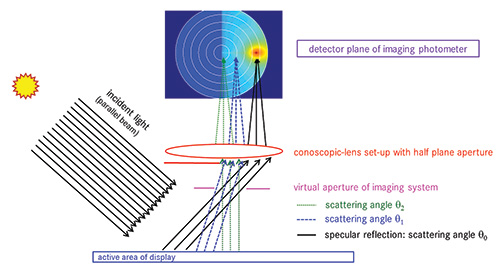
Fig. 6: These schematics show the conoscopic setup created to determine reflection/scattering properties of displays.
Figure 7 shows such a measurement for a typical automotive configuration, where the
information display is mounted in the center of the dashboard. The most critical situation appears when direct sunlight is incident on the display entering the interior of the car through the passenger side window close to the B pillar (see Fig. 2). The angle of incidence with respect to the display normal is then typically around θi = 45° and the driver observing direction at θd = 20°–30°. For an in-plane geometry (azimuth angles φd = φi +180°) it can be seen that Lr = LSunGun would be in the range from LSunGun ≈ 55 cd/m² (θd = 20°) up to LSunGun ≈ 250 cd/m² (θd = 30°) and as such influencing the legibility in a critical way. Therefore, the anti-glare properties of the display coating as well as the orientation of the display should be carefully chosen. For example, tilting the display by an angle φtilt would change the illumination/observation geometry by φd ≥ φi + 2φtilt + 180° (θd ≤ θi) while keeping θd almost unchanged. Looking at Fig. 7, it can easily be seen that changing the orientation φtilt in an appropriate way could improve the legibility dramatically.
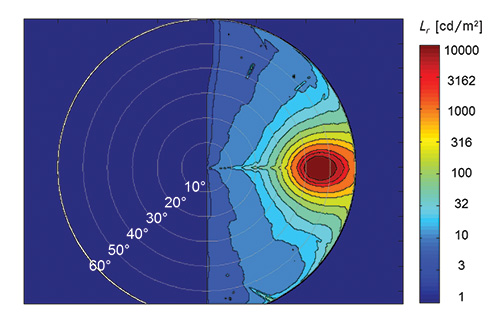
Fig. 7: This measurement is typical of a modern automotive display with high-quality AGAR coating. Incident light is at θ = 45° (azimuth angle φ = 180°). The specular reflection is clearly seen as maximum scattering amplitude Lr > 10.0000 cd/m² [at θ = 45° (φ = 0°)].
It can be shown that as long as LSunGun ≤ 3 × Ldiffuse (or better LSunGun ≤ 3 × Ldiffuse + 2 × Lv, considering the effect of veiling glare), then the legibility is most critically affected in diffuse daylight conditions and, consequently, the relationship shown in Fig. 5 would be valid in defining the required display properties. In the opposite case, one would first have to improve the display orientation and/or optimize the scattering behavior of the display or even drive the display at much higher luminances. It is worth mentioning that not only the scattering of the display surface but also the internal scattering mechanism might have a crucial influence. Electrode configurations in particular in certain LCD technologies and pixel structures of OLED displays can lead to distinct strong asymmetric scattering behavior and could therefore badly influence the legibility if not properly handled.
Thus far, we have only talked about legibility criteria that are important to minimize driver distraction during driving. However, the general value perception is also important in terms of optimizing customer satisfaction.
Therefore, we have conducted extensive customer studies to understand what parameters influence the value perception of displays during daylight situations.3 Figure 8 shows the schematic configuration we chose to show representative image content to our customers while independently varying the luminance contrast ratio of
the display, perceived color gamut (both measured during ambient light conditions without taking into account the effect of veiling glare), brightness of the display, and type of surface coating as well as the size of the display.
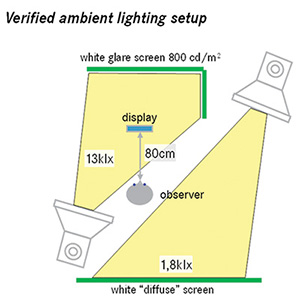
Fig. 8: This verified lab set-up was created to study the influence of display parameters on the value perception of a display. A combination of diffuse ambient light, direct “sunlight” incident on the display, and a veiling-glare light source were used to simulate
ambient light conditions during daylight driving.
While details of these studies will be published elsewhere, here we would like to focus on a somewhat astonishing result. As shown in Fig. 9, it can be seen that the value perception – measured as a subjective quality in a range from “very poor” to “very good” as a function of maximum contrast ratio of the display Cr,max (black/white contrast) – is greater for displays with pure glossy AR coating at Cr,max ≥ 10:1 and for strongly scattering AGAR coatings at Cr,max ≥ 15:1. On the one hand, this is a surprisingly good coincidence with our derived display criteria for diffuse daylight situations to ensure good legibility in modern UIs. On the other hand, it shows that during severe sunlight conditions it will be very difficult to reach the optimum in value perception because it would require a very high maximum luminance of the display. While static optimizations such as choosing a well-adapted display orientation will have their limits, here special measures like dynamic optimization of the UI content could be helpful to optimize customer satisfaction.
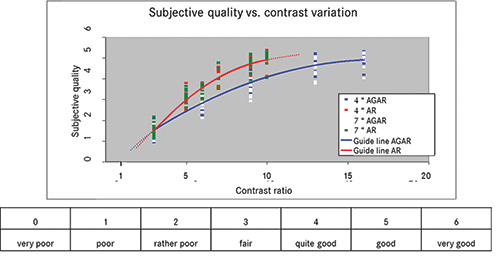
Fig. 9: Here, we illustrate subjective quality as a function of maximum contrast ratio Cr,max (black/white contrast) in typical automotive ambient light conditions (38 subjects). The different colored data points correspond to independently changing perceived color gamut and display brightness while keeping Cr,max at the same time constant. Different sizes of displays (4 and 7-in. diagonals) as well as two surface coatings (AR = glossy anti reflection, AGAR = matte anti-reflection/anti-glare coating) were tested. It can be clearly seen that the customers preferred glossy coatings to matte coatings even if that factor had no influence on perceived contrast and legibility.
Sensing Ambient Light Conditions
As mentioned above, two resulting components of ambient light (reflected light and veiling glare) are present, which mainly influence the perception of display content in ambient light. We propose a sensor to measure the angle-dependent illumination on the display and a sensor to measure the driver-relevant luminance for the veiling glare.
The sensor for the illumination should be placed closed to the display and aligned toward the emitting direction of the display. Here, then, the illumination from different angles onto the display has to be measured.
The veiling-glare sensor should be aligned toward the line of sight of the driver. We propose a sensor measuring the luminance of the street and the horizon in the driving direction.
With both sensors it is not possible to directly measure the influence on perception. Both measurements need to be combined with a model to calculate the resulting ambient light effect. Input data to those calculation models are:
Reflected Light:
• Angle-dependent illumination of the display
• Relative driver position to the display
• Display surface information (as measured earlier)
Veiling Glare:
• Driver relevant luminance
• The geometry of the car (field of view, display, and driver location)
• The (standardized) point-spread function of the human eye
In our model to calculate the reflected light, the display reflection and scattering characteristic (bidirectional reflectance distribution function or BRDF) are convoluted with the illumination data. The output data is the (angle-dependent) reflected light. Depending on the eye position of the driver, it is possible to derive the relevant reflected light.
To calculate the veiling glare, we utilized the (standardized) point-spread function of the human eye.4 The point-spread function provides the characteristic of light scattering inside the eye. In our model, we calculate the resulting veiling glare at the display position by convoluting the point-spread function with the geometrically dependent luminance image of the car interior. The geometrical image that we derive from the CAD data of the car represents the visual field of the driver with ±60° horizontally, ±30° vertically (see Fig. 10). To simplify the calculation, we assumed 0 cd/m² for the car interior and set the window areas (blue area) to the measured glare luminance seen through the windshield. With this model, it is possible to derive the complete distribution of the
veiling glare in the car interior. Based on this calculation, it is then possible to define the veiling glare relevant for the driver display (instrument cluster) and central display. For the example shown, the relevant luminance at the instrument cluster display (gray box) and the central display (white box) is around 30–40 cd/m².
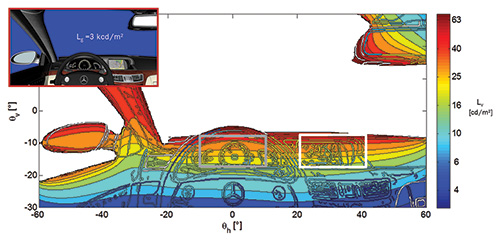
Fig. 10: Veiling-glare distribution in the car is shown with a simplified homogeneous glare luminance seen through the windshield and the side window of Lg = 3 kcd/m². The resulting veiling glare (inside the car) is caused by the scattering in the human eye and leads to a perceived luminance that is added to the display’s luminance of around LV = 30–40 cd/m². For the calculation, a true-scale geometric CAD model of the car interior was used. The veiling-glare distribution is calculated by the convolution of the point-spread function of the human eye with the luminance distribution truncated by the geometric model of the car. The viewing angle in the geometric model matches the driver‘s viewing angle ±60° horizontally, ±30° vertically.
Active Adaptation and Optimization of Display Performance
The ambient light in the car can change quickly, e.g., when the car enters a tunnel or changes driving direction, or it can be constant for a long time, e.g., when driving at night on a highway. To address this, we combined the high display quality from the static optimization with the measurement of the ambient light situation to dynamically optimize the display performance depending on the ambient light situation. We aimed to optimize the following parameters dynamically:
• Display luminance (e.g., via backlight intensity variation)
• UI design (e.g., day/night optimized design).
• Optimization of the display‘s black level by local dimming.
• Optimization of the gray-level distribution for better readability.
• Optimization of the global and local contrasts.
As a basis for all dynamic optimization, we considered the display-luminance adaptation. With this adaptation, we achieved a significant optimization of the overall display performance depending on the ambient light. Based on the findings earlier in this article, we aimed to keep the contrast, at ambient light, at a ratio of 10:1 or 15:1 depending on the display surface. With a maximum white luminance of the display of around 500–800 cd/m², this is possible for most daylight conditions.
An issue at night is often the integration of the display. This is caused when the LCD‘s black luminance is brighter than the surrounding dashboard of the car. With a high static contrast of the display, this can be addressed. An active optimization of the black level of the display is possible through
using local dimming for LCDs.5,6
Besides the contrast and black-level improvements for low ambient light conditions, the readability and visibility content in bright ambient light conditions is a quality criterion. We aimed to enhance the readability through two different approaches – one for entertainment and the other for UI content.
Entertainment content, like movies, is often optimized for dark ambient light conditions such as cinemas. Here, the content creators are using the dynamic range of the content to support the immersion of the viewer. For this reason, the content consists of mostly dark and medium colors, which leaves the bright colors for glare-like effects or bright flashes. In the car, due to the ambient light and the smaller displays, those immersion effects do not work as expected by the content creators and can lead to imagery that is difficult to perceive.
To reduce the effects of ambient light on entertainment content, we used a two-step algorithm: DIE & DOP.7 In the first step, the image (a1, A1) was analyzed and the usage of the dynamic range is optimized by the “dynamic image enhancement” algorithm (DIE, Fig. 11, a2, A2). On average, this led to an increase in contrast by more than a factor of 2. In the second step, the gray-level degradation by the ambient light (see Fig. 4, left) is compensated by the “daylight optimized perception” algorithm (DOP, Fig. 11, a3, A3). With the DOP, the gray values are remapped to achieve a linear gray value perception in the ambient light situation. As a result, the picture appears a lot more visible due to the higher contrast and details in dark gray values can be seen and differentiated.
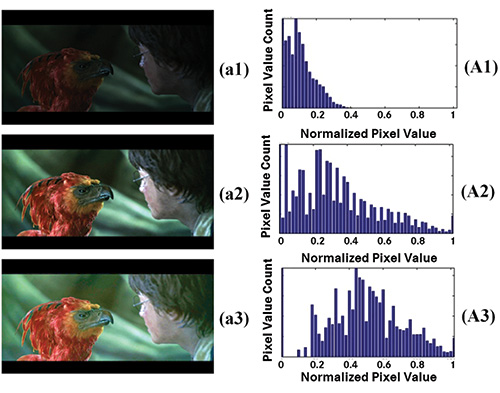
Fig. 11: The images include (a1) original image, (a2) DIE enhanced image, (a3) DIE & DOP enhanced image, (A1) histogram original image, (A2) histogram DIE enhanced image, and (A3) histogram DIE & DOP enhanced image (rendered for daylight setting).
Such algorithms have already successfully been implemented in a series of in-car entertainment functions. A new approach aims to optimize the UI content. In opposition to entertainment content, the UI is daylight and sunlight optimized. This means the complete dynamic range (black to white) is utilized by the UI. Hence, a global remapping of the gray values to achieve a better dynamic range utilization, as it is applied for DIE, is most likely not possible. The compensation of the gray-value degradation DOP can be applied, but the ISO15008 specification has to be considered carefully, as some contrast levels for bright colors can be degraded by DOP. To enhance the readability, especially for sunlight conditions, it is possible to optimize the local contrasts by local enhancement such as edge filtering and or un-sharp masking of the picture as shown in Fig. 12.
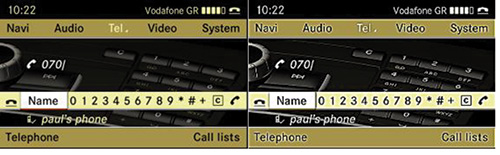
Fig. 12: Sunlight optimization of UI content appears above with an edge enhancement filter applied to gain readability of the UI content.
In summary, we have shown that the quality and legibility requirements of automotive displays at night and in ambient light conditions are complex but can be analyzed in detail. Consequent configuration of the display location and orientation as well as passive and dynamic optimization and adaptation will optimize legibility and
minimize driver distraction. In the future, new approaches such as local dimming and HDR-UI concepts will enhance the value perception of in-car information and infotainment systems.
References
1SAE International, “Standard metrology for vehicular displays,” SAE J1757/1, 2015-05.
2ISO, “Road vehicles – ergonomic aspects of transport information and control systems – specifications and test procedures for in-vehicle visual presentation,” DIN EN ISO 15008:2015.
3J. Bauer, M. Kreuzer, T. Ganz, B. Straub, H. Enigk, and N. Boemak,“New ways from visual perception and human contrast sensation to better readable displays in automotive environments,” Electronic Displays Conference, 2010.
4J. J. Vos and T. J. T. P. van den Berg, “Report on disability glare,” CIE collection 135, 1–9 (1999).
5M. Albrecht, A. Karrenbauer, T. Jung, and C. Xu, “Sorted sector covering combined with image condensation – an efficient method for local dimming of direct-lit and edge-lit LCDs,” IEICE Transactions on Electronics 93, No. 11, 1556–1563 (2010).
6M. Albrecht, D. Schäfer, C. Xu, J. Bauer, and M. Kreuzer, “LSF Correlator: An Amending Module for SSC Local Dimming Algorithm to Increase the Static Contrast of Edge-Lit LCDs,” SID Symposium Digest of Technical Papers 42, No. 1, 1458–1461 (2011).
7J. Bauer and M. Kreuzer, “Dynamic optimization of video content presentation on automotive displays,” EuroDisplay, International Display Research Conference, Vol. XXXI (2011). •
Jan Bauer is responsible for Video Handling and High Speed Video Links at the R&D center of Daimler AG in Sindelfingen, Germany. Markus Kreuzer is responsible for the Display Competence Center at the R&D center of Daimler AG in Sindelfingen, Germany. The authors can be reached at jan.j.bauer@daimler.com and markus.kreuzer@daimler.com, respectively.