A preview of the papers appearing in the September 2007 issue of theJournal of the SID. To obtain access to these articles on-line, please go to www.sid.org
Edited by Aris Silzars
Measurement and modeling of adaptation to noise in images
Mark D. Fairchild
Garrett M. Johnson
Rochester Institute of Technology
Abstract — Webster has proposed "that adaptation increases the salience of novel stimuli by partially discounting the ambient background." This is an excellent, concise, description of the purpose and function of chromatic adaptation in image-reproduction applications. However, Webster was not limiting this proposal to just chromatic adaptation, but rather using it as a general description for all forms of perceptual adaptation. Demonstrations of adaptation to other properties of image displays such as motion, blur, and spatial frequency led the authors to ponder the question of whether observers might adapt to the noise structure in images to enhance the novel stimuli — the systematic image content. This phenomenon, noise adaptation in images, was easily demonstrated, but apparently has not been carefully studied in the past. Psychophysical measurements of noise adaptation in color image perception is described and mathematical prediction of the effect is explored. The results illustrate the hypothesized pattern-dependent adaptation and its prediction through adaptation of a 2-D contrast-sensitivity function in an image-appearance-model-based difference metric.
Webster's observations of adaptation in natural images led the authors to hypothesize that the human-visual system might be capable of adapting to noise content in images, effectively enhancing the perception of image content while minimizing the perception of artifacts introduced by imaging systems. Quantitative knowledge of such adaptation effects is critical for the development of accurate image-quality metrics. A visual demonstration of noise adaptation in images is easily created as illustrated in Fig. 3. Adaptation to the images at the top will result in the lower-left image appearing noisier than the lower-right image despite being physically identical.

FIGURE 3 — Demonstration of adaptation to image noise.
Preferred memory and accent colors shown on a display
Youngshin Kwak
JiYoung Hong
Du-Sik Park
Samsung Advanced Institute of Technology
Abstract — The preferred green-grass and red (apple, lipstick, sports car) colors shown on the display are investigated using complex images. Ten test images were used in the experiment and each image was transformed using a memory color transformation algorithm to have nine different green-grass or red colors. The pair comparison method was used to determine the most-preferred green-grass and red colors. The green-grass colors are preferred as the average hue angle approaches 128° (60% green and 40% yellow) in CIECAM02 hue angle with high chroma. For red colors, apple images show high preference when the reproduced red is closer to the unique red. The artificial objects, such as red lipsticks and sports cars, are preferred when reproduced with the highest chroma regardless of their hues.
The major TV manufacturers have been developing color-control algorithms that transform a specific color to other colors to reproduce the preferred memory or accent colors. For example, Samsung TV with a DNIe chip offers a "My Color Control" function to adjust skin, green-grass, and blue-sky colors as the user prefers. The preferred accent colors can be achieved by controlling hues and chromas of the primary colors. For the efficient use of preferred color-reproduction algorithms, the determination of which colors are preferred by the viewers is essential.
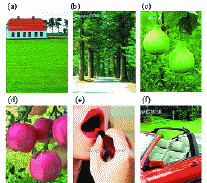
FIGURE 6 — Examples of the test images used in the experiment.
Competing display technologies for the best image performance
Adrianus J. S. M. de Vaan
Philips Consumer Electronics
Abstract — Cathode-ray tubes (CRTs) have been the dominant display technology for years, having the best image performance and low cost. During the last several years, flat-panel-display technologies, such as liquid-crystal displays (LCDs), began to replace the CRT mainly because of its favorable form factor. Today, the image performance of LCDs are equal to that of a CRT, and attractive flat-display products have become so affordable that they have replaced the CRT from its dominating market position and have obtained the largest market share. In the past, the CRT set the standards for digital imaging technologies, but today, modern image capturing, storage, transport, signal processing, and printing technologies have improved to such high levels that they demand better display technologies and standards. At present, the LCD is at the forefront of this display-technology evolution. This paper will focus on the latest image-quality improvements in LCD technology and briefly touch alternatives such as plasma-display panels (PDPs) and microdisplay projection. Special attention will be given to the latest developments in wide-color-gamut technologies and methods to reproduce accurate colors within a display device.
Currently, wider-color-gamut displays are already produced by applying new phosphor materials in the fluorescent tubes of the LCD backlight, respectively, as phosphor material in the PDP. Especially for LCDs, there are many possibilities to further increase the color gamut such as LED backlighting and/or MPC. LEDs, as a future lighting technology, look favorable for LCD-backlight solutions offering wider color gamut (>105% NTSC) and simultaneously allows for 2-D backlight dimming. Multiple-primary-color technologies are promising for color-sequential systems such as single-panel DLP or future color-sequential LCDs and offer wider color gamut, higher brightness, and a lower cost solution simultaneously.
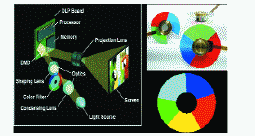
FIGURE 7 — Wide-color-gamut projector using five primary colors.
Multi-primary design of spectrally accurate displays
Moshe Ben-Chorin
Dan Eliav
Genoa Color Technologies
Abstract — Spectral color reproduction overcomes some inherent problems of colorimetric reproduction. An implementation of a spectral display for surface color reproduction, capable of reproducing a desired spectrum for each pixel, based on multi-primary projection technology, is presented. A light source with a spectrum identical to that of the illumination is filtered by a positive linear combination of several color filters, which reproduces the reflectance spectra. The spectra of the color filters are tailored to span the space of possible surface spectra. Various methods for choosing the color filters vis-à-vis the required performance are discussed in detail. Soft-proofing application is examined as a test case for the concept.
The spectral reproduction mode is fundamentally different from the others. Rather than trying to mimic the sensation of color, it tries to reproduce the physical signal that creates it; namely, the spectrum of the impinging light. Thus, if one observer finds the original scene and its reproduction to be identical (because the spectra reflected or emitted from both were equal), agreement is likely to be found between all other observers, including color blinds, regardless of their interpretation of the sensation and the name they would give it.
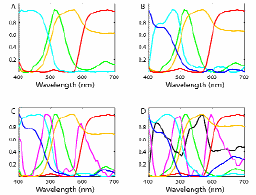
FIGURE 4 — Sets of 4 (A), 5 (B), 6 (C), and 7 (D) basis functions derived by non-negative matrix factorization.
Spatially uniform colors for projectors and tiled displays
Alain Pagani
Didier Stricker
Fraunhofer Institute for ComputerGraphics Research IGD
Abstract — A major issue when setting up multi-projector tiled displays is the spatial non-uniformity of the color throughout the display's area. Indeed, the chromatic properties do not only vary between two different projectors, but also between different spatial locations inside the displaying area of one single projector. A new method for calibrating the colors of a tiled display is presented. An iterative algorithm to construct a correction table which makes the luminance uniform over the projected area of one single projector is presented first. This so-called intra-projector calibration uses a standard camera as a luminance measuring device and can be processed in parallel for all projectors. Once the color inside each projector is spatially uniform, the set of displayable colors – the color gamut – of each projector is measured. On the basis of these measurements, the goal of the inter-projector calibration is to find an optimal gamut shared by all the projectors. Finding the optimal color gamut displayable by n projectors in time O(n) is shown, and the color conversion from one specific color gamut to the common global gamut is derived. The method of testing it on a tiled display consisting of 48 projectors with large chrominance shifts was experimentally validated.

FIGURE 7 — Intensity profile, absolute correction, and corresponding picture of 12 projectors showing a level of green color before the iterative shading correction.

FIGURE 8 — Intensity profile, absolute correction, and corresponding picture of 12 projectors showing a level of green color after the iterative shading correction.
Image-color-quality modeling under various surround conditions for a 2-in. mobile transmissive LCD
Youn-Jin Kim
M. Ronnier Luo
Peter Rhodes
Won-Hee Choe
Seong-Deok Lee
Seung-Sin Lee
Youngshin Kwak
Dus-Sik Park
Chang-Yeong Kim
University of Leeds
Abstract — This study aims to develop an image-color-quality (ICQ) model for a 2-in. mobile transmissive liquid-crystal display (LCD). A hypothetical framework for ICQ judgment was made to visually assess ICQ based on the cognitive processes of the human visual system (HVS), and then an illumination adaptive ICQ model applicable for various surround conditions was developed. The memory color reproduction ratio (MCRR) of a locally adapted region of interest in a complex image reproduced on a mobile display was first computed. The colorfulness index and luminance contrast for all of the pixels in the image were then calculated by a global adaptation process. Finally, an ICQ model including all of the three attributes was developed under dark conditions using an assessed set of psychophysical data. The model gave more accurate performance than the mean accuracy for all of the observers. It was also visually tested under three different outdoor conditions, including overcast, bright, and very bright conditions, and the illuminance level range was from 7000 to 35,000 to 70,000 lx. The effect of outdoor illumination could be quantified as an exponential decay function and the ICQ model could be extended to cover a wide variety of outdoor illuminations conditions.
Traditionally, certain well-defined physical characteristics of displays, such as the electro-optical transfer function (EOTF), white luminance, gray tracking, additivity error, and color-gamut size, are often measured; however, the measurement and evaluation of a display's perceived quality has not been well studied. In addition, the effect of ambient illumination should be quantified, especially for evaluating the image quality of portable displays.
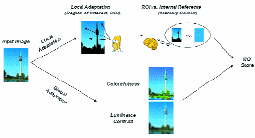
FIGURE 1 — Proposed ICQ judgment framework.
Physical-based photon mapping for an LED backlight lighting simulator
Chang-Hwan Son
Myong-Young Lee
Cheol-Hee Lee
Yeong-Ho Ha
Kyungpook National University
Abstract — Liquid-crystal displays (LCDs) have become increasingly popular due to their lower price and larger sizes. In particular, backlights having an RGB LED source have recently attracted attention because they have a wider color gamut, higher luminance, and lower power consumption. However, even when the backlight area is uniformly covered with light modules based on arrays of individual LEDs, this does not ensure a uniform chromaticity and luminance over the backlight panel, thereby stressing the need for lighting simulation of the backlight.
This paper proposes an effective lighting simulator to predict the chromaticity and luminance distribution of an LED backlight panel for an LCD. First, the spectrum-based photons are all initially generated using a random function with a constraint satisfying the spectral power distribution of the actual LED light sources, while their emitting directions are determined based on a pre-calculated probability using a random variable angle. The optical characteristics of the inner sheets in the LCD backlight structure are then modeled using the wavelength and incident angle to predict the next direction of each photon based on the reflection and transmittance at an intersection. All the photons that reach the unit area of the outward panel are gathered to shape their spectral power distribution, then converted to CIEXYZ values and multiplied with a color-matching function. Finally, a realistic image visualization of these CIEXYZ values is achieved through standardized device characterization using the sRGB mode. Experiments confirm that the proposed spectrum-based photon mapping can effectively predict the chromaticity and luminance distribution of an LED backlight panel, providing a good lighting simulation of an LED backlight before manufacturing the LCD.
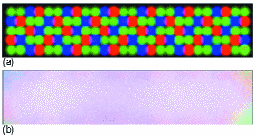
FIGURE 13 — Backlight simulation for 130 LEDs. (a) For radiation angular range of 170–180°; (b) For radiation angular range of 120–180°.
Art, science, and appearance in HDR
John J. McCann
McCann Imaging
Abstract — High-dynamic-range (HDR) image capture and display has become an important engineering topic. The discipline of reproducing scenes with a high range of luminances has a five-century history that includes painting, photography, electronic imaging, and image processing. HDR images are superior to conventional images. There are two fundamental scientific issues that control HDR image capture and reproduction. The first is the range of information that can be measured using different techniques. The second is the range of image information that can be utilized by humans. Optical veiling glare severely limits the range of luminance that can be captured and seen. It is the improved quantization of digital data and the preservation of the scene's spatial information that causes the improvement in quality in HDR reproductions.
Figure 5 shows an example of a very-efficient digital multi-resolution HDR algorithm, using spatial comparisons first shown in the Annual Meeting of Society of Photographic Scientists and Engineers in 1984. Here, spot photometer readings show that the illumination in the sunlit foreground is 32 times brighter than in the shade under a tree. That means that the sunlit black square has the same scene luminance as the white card in the shade. Prints cannot reproduce 32:1 in sun, plus 32:1 in shade (dynamic range 32:2) because the entire print range is only 32:1 in ambient light. Using the spatial comparison algorithms described in detail by Frankle and McCann, it is possible to synthesize a new 32:1 image that is a close estimate of what we see.

FIGURE 5 — An example of an HDR scene processed with spatial comparisons (1978 Frankle and McCann patent application). The illumination on the white card in the shadow is 1/32th of that on the black square in the sun. Both the white card in shade and black square in sun have the same luminance. The spatial-processing converted equal input digits (~log luminance) into very different output digits, thus rendering the HDR scene into the small range of the reflective print shown here.
Camera and visual veiling glare in HDR images
John J. McCann
Alessandro Rizzi
McCann Imaging
Abstract — High-dynamic-range (HDR) images are superior to conventional images. The experiments in this paper measure camera and human responses to calibrated HDR test targets. A 4.3-log-unit test target, with minimal and maximal glare from a changeable surround, was calibrated. Glare is an uncontrolled spread of an image-dependent fraction of scene luminance in cameras and in the eye. This standard test target is used to measure the range of luminances that can be captured on a camera's image plane. Further, the appearance of these test luminance patches was measured. Why HDR is better than conventional imaging is discussed, despite the fact the reproduction of luminance is inaccurate.
Recently, multiple exposure techniques have been combined with LED/LC displays that attempt to accurately reproduce scene luminances. However, veiling glare is a physical limit to HDR image acquisition and display. Camera calibration experiments using a single test target with 40 luminance patches covering a luminance range of 18,619:1 (4.3 log units) were performed. Veiling glare is a scene-dependent physical limit of the camera and lens. Multiple exposures cannot accurately reconstruct scene luminances beyond the veiling-glare limit.
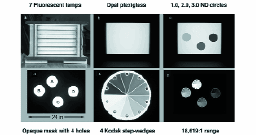
FIGURE 1 — (a) Light source made of seven fluorescent tubes (20 W). (b) An opal-Plexiglas diffuser placed 15 cm in front of the lamps. (c) The addition of three circular neutral density filters attached to the Plexiglas with densities of 1.0, 2.0, and 3.0. (d) An opaque mask that covered the entire lightbox except for four circular holes registered with the N.D. filters. (e) An enlarged view of a single Kodak Projection Print Scale. (f) Assembled 4scaleBlack target with a dynamic range of 18,619:1.
HDR image compression and evaluation based on local adaptation using a retinal model
Lijie Wang
Takahiko Horiuchi
Hiroaki Kotera
Shoji Tominaga
Chiba University
Abstract — The retinal adaptation process helps the human visual system to see high-dynamic-range (HDR) scenes in the real world. A simple static local adaptation method for HDR image compression based on a retinal model is presented. The proposed simple model aims at recreating the same sensations of the human visual system between the real-world scene and the range compressed image on the display device when viewed after the human visual system reaches the steady local adaptation state, respectively. In computing scene local adaptation, the use of a non-linear edge-preserving bilateral filter not only presents a better tonal rendition in compressing local contrast and preserving details but also avoids banding artifacts across high-gradient edges. Our new model relates the display adaptation with the scene adaptation based on the retinal model. In order to verify the effectiveness, a subjective evaluation is made by comparing the real scene and the display image using the paired comparison technique.
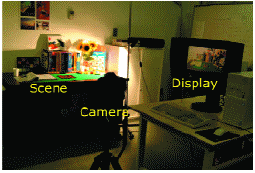
FIGURE 7 — Experiment setup for tone-mapping algorithm evaluation using real-world scene.
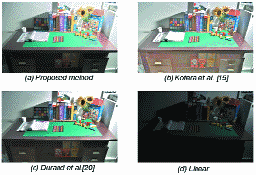
FIGURE 8 — The results of scene A.
Analysis of response-time compensation for black-frame insertion
Taesung Kim
Bongim Park
Byung-Hyuk Shin
HyoungSik Nam
Brian H. Berkeley
Sang Soo Kim
Samsung Electronics Co.
Abstract — An impulsive driving technique has been widely adopted for the elimination of motion blur in LCDs. Although the problem of slow temporal response time is very well known for LCDs, the inherent motion blur of moving objects in hold-type displays has a more-serious impact on display performance. It is well known that even very fast LCDs with zero response time still suffer from the motion-blur artifact due to hold-type driving effects. However, a fast temporal response is also critical in order to maximize the blur-reduction effect even in the case of impulsive driving. In this paper, the special behavior of LC molecules in an impulsive driving environment has been analyzed especially for the case of black-frame insertion, and an effective means to implement optimized response-time compensation (RTC) for the black-frame insertion technique is proposed.
Figure 11 shows photographs that compare the scrolling images with black-frame insertion on and off. The image scroll direction is from right to left at a speed of 8 pixels/frame. The blur reduction effect is quite noticeable when black-frame insertion is employed. In this pic-ture, a gray level of 15 was inserted with a 25% duty ratio. Undoubtedly, if the insertion time (as a percentage of total frame time) is increased, then the motion-blur performance will be better. However, as is well known, better motion-blur performance would be achieved at the expense of decreased luminance and increased wide-range flicker.
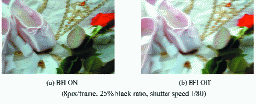
FIGURE 11 — Moving-image photo.
Optimization of operating parameters of video display units in text reading task: Luminance contrast, viewing distance, and character size
Zulquernain Mallick
Irfan Anjum Badruddin
Universiti Sains Malaysia
Abstract — The purpose of this study is to determine the reading performance of operators on a desktop computer. The effects of luminance contrast, viewing distance, and character size on the speed of reading were investigated. The luminance contrast between the background and character was varied while color contrast was held near-constant. Stimuli with different levels of character size, viewing distance, and luminance contrast were considered while assessing the readability performance. The luminance contrast between the background and character (0.01, 0.15, and 1.00), character sizes (0.2, 1.5, and 4°), and viewing distance (40, 50, and 60 cm) were used, and the performance of the operators were recorded in terms of words per minutes (WPM). Standard workplace design recommendations to position the center of the visual display terminal (VDT) 15° and 40° below horizontal eye level were used for the visually intensive readability task. An orthogonal array, the signal-to-noise (S/N) ratio, and the analysis of variance (ANOVA) were employed to investigate the above-mentioned operating parameters to determine the optimum readability performance. The results indicated that performance was better at a 15° viewing angle as compared to a 40° viewing angle.
The stimuli presented to the subjects on the LCD screen were in Malay language, written in usual Roman script, with a spacing between the lines of 1 mm. The characters per screen of text were arranged in 25 lines. Three different texts of required length were presented to the subjects for the readability task to avoid any learning effect included in the experiment. Subjects were instructed to scroll through the stimuli by clicking the down arrow button on the keyboard as they read. For a specific viewing distance, the letter size required was adjusted.
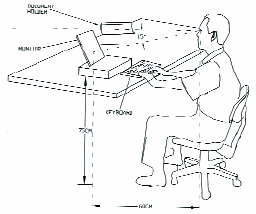
FIGURE 1 — The workplace arrangement and schematic diagram of experimental set-up.