Analysis of 2D/3D Image Data for 3D Visualization During Image-Guided Interventions
Three-dimensional imagery is critical to many medical procedures and, ultimately, to the health of the patient. This article examines ways that 3D imagery is making a differenceand what clinicians need and expect as the technology continues to evolve.
by Kenneth R. Hoffmann, Stephen Rudin, Hui Meng, Anant Gopal, Alan Walczak, Minsuok Kim, Sebastian Schafer, Peter B. Noel, Snehal Kasodekar, and L. Nelson Hopkins
MEDICAL IMAGES are now almost exclusively acquired by using digital systems. Large two-dimensional (2D) acquisition devices are used to acquire 2D projection images of the chest and the various organs. Tomographic modalities, i.e., computed tomography (CT), magnetic resonance imaging (MRI), and ultrasound, generate three-dimensional (3D) data of the patients. All of this data is stored in 1–10-terabyte archives for ready access to the clinicians. However, the analysis of the images remains primarily qualitative. Visual inspection of the images is used for diagnosis with the computer used as an adjunct. This analysis is limited to detection tasks, evaluation of the anatomy, and estimation of relative locations of objects used in interventions, e.g., locations of guidewires, balloons, or stents. In the 3D detection tasks, the intrinsically 3D tomographic data is viewed primarily as a sequence of 2D slices as clinicians scroll through the patient data. Thus, the full digital capability of the data may not be used in diagnosis and treatment.
Because of the ubiquity of digital data, a number of investigators and companies are developing tools for clinicians that may aid in the clinical tasks and decisions. Three-dimensional data is being presented using surface- and volume-rendering techniques. Computer-aided-diagnosis technology is assisting in the detection tasks. Image-analysis tools generate new information for clinicians, information that could not be obtained by assessing the anatomy alone. With this information, new understanding or knowledge of the patient, the disease, the therapy, and, ultimately, the prognosis for the patient can be better understood and determined. Thus, the direction of medical-data presentation could be viewed as moving from visualization to quantitation to information to knowledge.
Display manufacturers have certainly helped the medical industry as the data requirements have become more complex. The improved capabilities for viewing 3D data are certainly noteworthy and have allowed clinicians to be much more precise when it comes to implanting stents, assessing arterial plaque buildup and aneurysms, and determining the course of treatment. But the various methods of displaying 3D data all present their own challenges, whether they fail to offer display motion, require the use of glasses, or offer limited viewing angles, to name a few. Ultimately, displays will need to be able to show data as its dimensionality increases from anatomical 3D to functional/ anatomical nD. This will require new paradigms for display and interrogation that enable and promote perception of the multi-D data.
This article examines three examples of methods of information quantitation and generation that we believe will enable a new understanding of the patient and the treatment: plaque distributions, tortuousity of vessels, and patient-specific flow calculations using computational fluid dynamics (CFD). With these examples, we will illustrate the information that is becoming available to clinicians. It is important for display developers to keep this in mind as they develop the next generation of displays for medical usage – clinicians need this information to be displayed in a timely and comprehensible fashion, making the methods and technology used to display and present the data key to this process.
Kenneth R. Hoffmann is an Associate Professor in the Department of Neurosurgery at the Toshiba Stroke Research Center at the State University of New York (SUNY) at Buffalo, 455 Biomedical Research Building, 3435 Main Street, Buffalo, NY 14214; telephone 716/829-3595, fax 716/829-2212, e-mail: kh9@buffalo.edu.
Plaque Visualization and Quantitation
Atherosclerotic lesions (plaques) often encroach on the lumen and obstruct blood flow to varying degrees, leading to heart disease and stroke. The extent of arterial narrowing due to the plaques is assessed during catheter-based vascular interventions primarily in terms of its size and length. Because of its real-time imaging capability and high spatial resolution, X-ray projection imaging of the blood vessels (X-ray angiography) remains the primary modality for assessing the extent of arterial narrowing, especially in the interventional arena, serving both diagnostic as well as image-guidance roles.
Evaluation of the plaque is necessary to determine whether and how to intervene with the patient. In general, measurements of the plaque, its size or percent-narrowing, and its length are made using manual measurements on the images, even though there have been a number of techniques developed to automate these measurements. But they are limited to optimal views of the plaque, i.e., projection views in which the plaque lesion is on the edge of the vessel (as opposed to enface views). Each of these techniques has focused on the vessel, i.e., measuring the lumen. However, the plaque itself is also of interest.
A method has been proposed that uses a vessel-sizing technique with a twist to get at the intruding plaque (i.e., the portion of the plaque protruding from the vessel wall into the lumen). After acquisition of an angio-gram, the vessel of interest is indicated. The centerline is determined, and gray-scale intensity-data profiles perpendicular to the centerline are extracted along lines (profiles) perpendicular to the vessel axis. The profiles are fit with an elliptical model, optimizing the height of the ellipse as well as its width and centerline location; as such, this method is similar to a number of other model-based techniques. Subtracting the profile in the image in the diseased portion of the vessel from a profile from the healthy vessel region yields the intruding plaque [Fig. 1(a)]. Doing this for each profile in the image yields a "plaque image" [Fig. 1(b)]. Thus, clinicians can see plaque and its extent regardless of the projection or view that was obtained – they do not need an edge-on view of the plaque. Moreover, the measurement of the plaque volume is independent of view as well. However, this data is new, and it is unclear how to present it to clinicians, who are used to looking at the vessels.
(a) 
(b) 
(c) 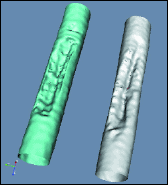
Fig. 1: Illustration of the concept of plaque identification using modeling and subtraction. (a) Subtracting the profile in the image in the diseased portion of the vessel from a profile from the healthy vessel region yields a "profile" of the intruding plaque. (b) When this technique is applied to the entire segment (all profiles), a "plaque image" is obtained. (c) 3D reconstructions of the lumen of a vessel phantom. Good agreement is seen between the lumen reconstructed using the two-view techniques (left) and that reconstructed using micro-CT (right) with 180° views.
If just one additional X-ray view (approximately orthogonal to the first) is available, the vessel lumen (cavity) can be reconstructed in 3D. One can consider the lumen as a stack of slices and work on reconstructing the 2D slices. Optimization techniques can be used for reconstruction of complex irregular shapes of lesions by refining an initial elliptical model. These are usually iterative and thus computationally expensive. Extending the plaque-image approach to the 2D lumen is a simpler, non-iterative approach. The healthy vessel cross section is reconstructed, first as a simple ellipse and then the intruding plaque is removed from the lumen in a manner consistent with the plaque images in the two views. With this, the entire lumen can be reconstructed from only two views. These results compare well with micro-CT in phantom studies [Fig. 1(c)].
These data will provide clinicians with more-immediate and more-complete information about the vessel lumen structure. This is still anatomy, but with quantitative 3D plaque volume and distribution now available from projection images, clinicians can make more informed decisions. The presentation of the information will be a key element in helping with this decision. Should one show 3D as in Fig. 1(c) or somehow convey the intrusion of the plaque on the vessel, allowing clinicians toperceive the asymmetric location of the plaque? Also, how is this 3D to be used – solely for diagnosis? Probably not. With 3D plaque information available, the intervention itself might be altered. Augmented reality showing the passage of a guidewire or catheter across the diseased portion is probably in the future. Thus, multiple devices, as well as the anatomic information, will need to be displayed, probably using various levels of transparencies for each of the objects. Will 2D viewing screens suffice to allow perception of the information necessary for the intervention or will stereoscopic or 3D viewing be required?
However, the goal is not only to provide the visual information crucial in the interventional suite, but also to enable more-complete quantitative analysis of the vessel. With the 3D plaque distribution, additional analyses become possible, such as longitudinal studies, planning of the intervention, evaluation of the plaque morphology, and calculation of vessel tortuousity.
Vessel Tortuousity
A variety of important vessels can have tortuous shapes. For example, the coronary vessels change shape during contraction. The internal carotid has multiple hairpin bends proximally near the siphon. Thus, guiding devices through the vessels is often difficult, with the difficulty increasing in the presence of vessel narrowing.
The first step to assisting clinicians is to provide the 3D vessel path and vessel lumen. The 3D vessel path and the vessel lumen can be determined from CT angiography (CTA), MR angiography (MRA), biplane imaging, or multi-projection imaging. In CTA or MRA, the vessel of interest must be identified and segmented from the 3D volume. The vessel and vessel lumen then must be parameterized.
(a) 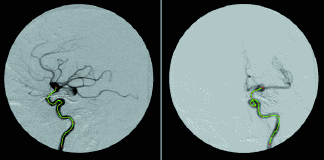
(b) 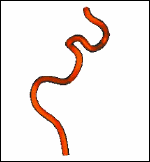
(c) 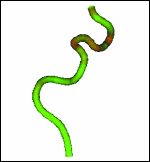
Fig. 2: Illustrations of two views used for the determination of 3D vessels. (a) The angiograms are displayed and the centerlines (green) are indicated. These centerlines are used to optimize the imaging geometry and generate the 3D vessel centerline and lumen. (b) The 3D vessel generated from the two views after determination of the imaging geometry relating the two views are shown. The 3D vessel is rotated 180° relative to the image on the left in (a). (c) Illustration of extrinsic vessel tortuousity for a 10-mm-long rigid stent where red corresponds to high tortuousity and green corresponds to low tortuousity. Because the 3D vessel can be calculated for each patient, the evaluation of difficulty and tortuousity can be patient and stent specific.
For X-ray projection images, the vessel must also be identified, e.g., via manual indication [Fig. 2(a)]. After indication, the imaging geometry should be optimized because the gantry information can be inaccurate due to imprecision of the data provided and/or mechanical variabilities, such as gantry sag. The "imaging geometry" is the set of transformations that relate all the individual acquisition positions with some "world" system; this effectively involves determining the rotation and translation relating each projection with the world system.
The techniques developed in our laboratory do not require the use of a calibration object. Rather, we use just the data in the images themselves for calibration of the imaging geometry, optimizing the consistency of the calculated 3D with the data in the images; thus, this can be considered a self-calibrating technique. We can make use of all of the projections obtained during the normal course of the intervention so as to provide the best 3D possible. This technique, therefore, does not require additional acquisitions. With the imaging geometry, triangulation techniques can be employed to determine the 3D position of the vessel centerline points. Vessel sizing or reconstruction techniques can be used to reconstruct the vessel lumen. When the 3D vessel information is determined, 3D visualization [Fig. 2(b)], augmented reality, training, and haptics applications can be brought into the interventional suite.
The 3D information may also be useful for helping clinicians decide how to go forward with the intervention in terms of selection of the interventional device and/or its properties. Vascular interventions usually involve passing a guidewire through the vessel, over which an angioplasty balloon or a balloon/stent device will be passed. We have observed that clinicians sometimes have difficulty moving the device through the vessel and that more tortuous vessels present more difficulty. Methods for calculating the vessel's tortuousity have been developed. However, we believe that the characteristics of the device being passed should be combined with the 3D information to allow assessment of accessibility of a distal site and where difficulties might be encountered along the path to the site. This combination could provide a measure of the "extrinsic tortuousity," which will be related to how or whether a particular device will proceed easily or with difficulty to the site of interest.
To provide an impression of difficult regions along the vessel axis, we can encode the calculated tortuousity as a color wash. In Fig. 2(c), we present the point-specific tortuousity for a patient in whom a 10-mm rigid stent will be passed, with the tortuousity encoded as green for easy passage and red for non-passage. Because this is a 3D rendering, the 3D vessel path and the tortuousity can be viewed at any chosen angle to allow appreciation of the 3D twists and turns of the centerline, as well as the tortuousity. The tortuousity results are in agreement with the visual impressions of the regions of high curvature obtained by viewing the 3D vessel data. Using this presentation of tortuousity, clinicians can perceive regions that might present difficulty in passing stents of various lengths. As a result, we believe that this technology will provide the interventionalist with a rapid means of perceiving and assessing, qualitatively and quantitatively, not only the 3D path of the vessel centerline but also the accessibility of the interventional site, which should facilitate and improve cerebral interventions.
Rotating the vessel and displaying the color wash can reveal the 3D complexity of the vessel and the regions where problems may occur. But a more interactive display, most probably displaying the device (for which tortuousity has been evaluated) as it proceeds up the vessel, will likely be of more value to the interventionalist. Thus, as in the plaque situation, display of the various devices being used during the intervention will probably facilitate the interventional procedure. Moreover, the display could be used to inform the interventionalist as to how the intervention might proceed. Prior to the procedure, models could be generated and their paths illustrated, showing potential problems, or the interventionalist could do a mock intervention on the patient, perhaps even bringing in haptics for feedback. As with the plaque display, the type of display may impact the information conveyed.
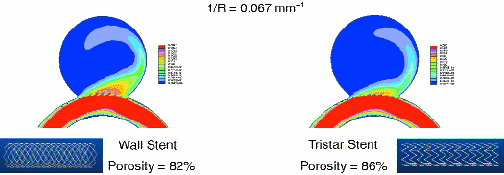
Fig. 3: Illustration of the effect of different stents on flow patterns in a CFD flow simulation. An aneurysm is on a vessel with a curvature of 0.067 mm-1. Stents were placed across the aneurysm. The flow velocities for the central plane of the vessel-aneurysm structure are shown. Red corresponds to high velocities and blue to low velocities. The flow volume and velocities entering the aneurysm for the wall stent (left) appear to be higher than those for the Tristar stent (right).
3D Aneurysm Analysis
Another vascular abnormality is an aneurysm. With CTA and MRA being performed more frequently, aneurysms are being discovered in asymptomatic patients. Computer analysis of the aneurysm morphology could provide an assessment of any longitudinal changes of volume and structure of the aneurysms as an aid to determine whether intervention may be needed. Also, patient-specific computational fluid dynamics (CFD) and intervention-specific results based on the 3D vessel geometry may provide the basis for better clinical decisions.
The first step in this process is segmentation of the aneurysm. If the aneurysm's location is known, then it can be segmented using region-growing techniques starting from a seed point in the aneurysm. For uniformity in region-growing, generation of an isotropic volume is suggested and can be performed using tri-linear interpolation or other interpolation techniques. With the ability to segment aneurysms and their parent vessels, patient-specific blood-flow analysis and evaluation of impact of interventions on aneurysmal blood flow can be performed. Non-feeder vessels are removed using clipping planes. Feeder vessels can be lengthened or shortened by varying the size of the volume to be grown or using clipping planes. Blood-flow calculations are performed using CFD software based on the Navier-Stokes equations (StarCD®, CD-adapco, Melville, NY). Boundary conditions can be set using typical carotid velocities and pressure waveforms. Steady as well as pulsatile flow conditions are investigated.
The results of CFD calculations of the velocity distribution of flow in a vessel phantom with an aneurysm and treated with either a Tristar or wall stent are shown in Fig. 3. The difference in the flow pattern for the two stents is clearly seen; in particular, the lower porousity stent has higher flow velocities entering the aneurysm, apparently because of the geometry of the stent. The geometry of the vessel also affects the flow into the aneurysm as is seen in Fig. 4. As the curvature of the vessel increases, the velocity and amount of the flow into the vessel increases. CFD calculations can provide the basis for new insight into flow patterns and treatment paths that would lead to the optimal treatment of the pathology.
Challenges
Medical imaging is moving from 2D images to 3D anatomy data sets to multi-dimensional data containing spatial, temporal, and/or functional information, looking at changes or impact. Yet clinicians continue to examine 3D data using primarily 2D slices, with 3D surface rendering often used to provide 3D perspective. Clinicians are not yet used to looking at and evaluating 3D data in a 3D format – it provides neither the resolution nor the speed to allow assessment of the patient. However, the ubiquity of 3D data and the subsequent analyses, such as those described above, are giving rise to new multi-dimensional data that must be displayed in some manner to convey the information.
Display technology is evolving, with more and more capabilities for viewing 3D data. Two-dimensional displays provide high repetition rates (72 frames per second, progressive) that allow real-time viewing of 2D projection or tomographic-slice data. Three-dimensional data are rendered for viewing usually via surface-rendering techniques (which requires some segmentation), with volume rendering utilized infrequently because of the speed of response – although some vendors provide reasonable speed for volume rendering, depending on the data set. By moving the rendered structures, clinicians can perceive the geometric relationships between the various structures. A number of stereoscopic viewers are available providing 3D perception without motion (though motion again facilitates 3D understanding), but most require use of special glasses. These are useful for viewing data off-line, but it is not clear whether the stereoscopic viewing, especially with special glasses, will be viable in the interventional clinical arena. Vaned displays, which provide 3D perception from a single screen, are becoming available; with these displays, special glasses are not required but the viewing angles are limited. Three-dimensional displays, using a variety of technologies – rotating screens, vibrating mirrors, multiple projection planes, etc. – are being developed and provide larger viewing angles. These 3D displays allow viewing of the 3D data sets. But, as with stereoscopic viewing, it is not clear whether these 3D viewers will be useful in the clinical arena.
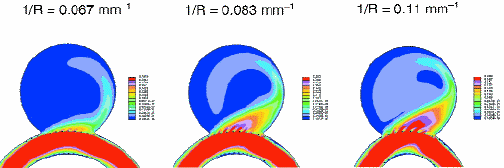
Fig. 4: Illustration of the effect of vessel geometry on flow entering an aneurysm in a CFD flow simulation. An aneurysm is on a vessel with varying curvatures. A Tristar stent was placed across the aneurysm. The flow velocities for the central plane of the vessel-aneurysm structure are shown. Red corresponds to high velocities and blue to low velocities. The flow volume and velocities entering the aneurysm change dramatically as the curvature of the vessel increases.
Clinicians require real-time display speeds, the ability to move around the data quickly, and the ability to zoom in and out. But this is when they can determine what they are looking for. However, 3D data, such as CT and MR, have values at each 3D point; thus, methodologies will need to be developed to allow rapid perception and interrogation of the relevant data. Transparency and overlays will facilitate this to a great degree, so that clinicians can see through the walls and see the voxel (volume pixel) value content of the data. Thus, the rapid movement in the spatial data will need to be coupled with rapid adjustments of the transparency and volumes rendered so that clinicians can locate and focus on the region of interest and its data.
The interrogation of the data will need to be coupled tightly with the analysis of the data. The analyses and their results will effectively increase the dimensionality of the data from anatomical 3D to functional/anatomical nD. The question remains: How can we use optimally surface vs. volume rendering, transparency/opacity, motion/time change, and point density/size to communicate the critical information to clinicians? Currently, 4D is presented using motion, 3D displays, and a color wash. Temporal changing of the 3D or the color wash can provide the means of perceiving 5D and perhaps 6D. The moving and changing of color-washed structures may provide the means for perceiving 7D. These may suffice, but it would seem that new paradigms for display and interrogation that enable and promote perception of the multi-D displays will be needed.
In summary, medical imaging is transitioning from 2D to 3D, to nD, to nD visualization, to quantification, to information, perception, and to knowledge – knowledge that will lead not only to improved patient diagnosis and treatment but also to improved patient prognosis.
Acknowledgments
The authors would like to acknowledge support from NIH grants R01 HL52567, R01 EB02916, R01 EB02873, R01 NS43924, and the Toshiba Medical Systems Corp. •