Shifting TFT-LCD Industry Will Require New Forecasting Methods

by David Barnes
Monitoring the thin-film-transistor liquid-crystal-display (TFT-LCD) industry is like watching rush-hour traffic. Drivers respond at different rates, but they are all governed by red lights and green lights. The harder they hit the accelerator, the harder they hit the brakes. If they drive a small car, they might only see the SUV in front of them. Somehow, sometime, everybody gets where they are going, but it is hard to get ahead.
Up until now, this analogy has extended well to two key questions for the TFT-LCD industry: How can prices be forecast? and how can industry price (profit) cycles be predicted? However, as the industry changes, it is getting more difficult to address these two crucial issues. But before we explore this, let's take a look at how these two metrics are currently predicted.
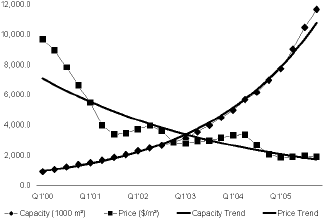
Forecasting prices for TFT-LCDs is simple — just look at the past three or more years of average price per square, calculate the exponential trend, and expect that to continue. Square what? Square anything: meters, inches – it does not matter as long as it measures the display area, because that is what people buy.
If we look at any business cycle, we will see the price of the latest super-duper market-changing panel format converge on the average price per square. In the prior business cycle, we saw wide-format notebook-display price premiums decline to zero on an area basis. In the current cycle, we see wide-format monitor-panel price premiums falling to zero. New display formats give the marketing departments at panel manufacturers something to talk about, but they seldom give their shareholders something to smile about.

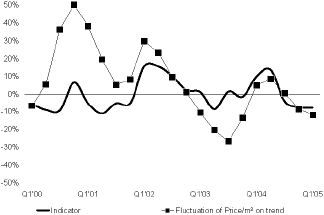
That is why it is vital to be able to predict industry price (profit) cycles. This, too, is relatively easy. Plot the acceleration of TFT capacity and turn the chart upside down. When the rate of capacity growth increases, prices fall below the long-term rate of decline. When the advance of growth decreases, prices rise to a cycle peak.

At least, that's the way it has been for nearly a decade. However, if you ask me those questions next year, my answers might not be so glib. It has been easy to model the TFT-LCD industry because so many factors had constant rates of increase or decrease. TFT capacity grew at a nearly constant annual rate of about 50% a year since the late 1990s. This caused real prices to fall about 20% a year. Demand is elastic (responsive) to price, so the relationship between display-area output and display-area price was a simple power function. But what happens when the growth of TFT capacity slows?
That is the situation pending in mid-2007. Analysts could see that an S-curve fit the forecasted capacity data better than an exponential curve did in 2006. Recent announcements by AU Optronics Corp., LG.Philips LCD, and others indicate that the rate of deceleration will be greater after 2008 than expected only a few quarters ago. The point of deceleration has not changed, but panel makers are hitting the brakes harder. Panel makers will face less pressure to reduce prices as fast (or faster) than they can reduce cost. On the other hand, TV makers will have more trouble getting all the panels they need to meet their share targets. Will this lead to more brand-panel joint ventures such as S-LCD (a joint venture between Samsung and Sony)? Will TV brands provide pre-payments for supply agreements? Ask me next year. •
David Barnes is Vice President of Strategic Analysis for DisplaySearch, 1301 S. Capital of Texas Highway, Ste. B125, Austin, TX 78746, e-mail: DBarnes@DisplaySearch. com.